In the first part of this series, we introduced the term Efficiency Island, a graphical representation of the improvements available to the best operating performance in a centrifugal pump. In this article, we will continue to examine how Efficiency Islands can, from a system perspective, address new system efficiencies or lead to the retrofit and improvement of existing systems—especially for the designers and operators of HVAC systems for buildings and facilities, whose systems have substantial load variations (flow rates) depending on the load profile.
Part 1 concluded with a comparison of maximum diameter efficiencies is done using percent of BEP flow, specifically the Hydraulic Institute (HI) Preferred Operating Range (designated POR) of 70 to 120 percent of BEP flow rate to ensure a consistent comparison is made among pumps with somewhat differing BEP flow rates. In part 2 of this series, we will continue our look at efficiency comparisons, this time beginning with reduced diameter impellers and their effect on Efficiency Islands.
REDUCED DIAMETER EFFICIENCY COMPARISONS
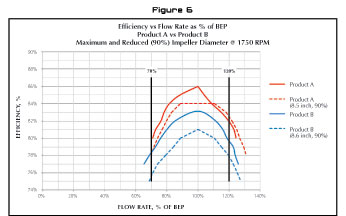
Figures 6 and 7 compare efficiency at maximum and for Products A and B. In figures 6 and 7 the maximum diameter efficiency is shown as the solid line for the two products and the reduced diameter in the dotted line of the same color. A historical specification requirement limiting the impeller diameter to 90 percent of the maximum impeller diameter is used for this illustration. Note the efficiency of the reduced impeller diameter (figure 6) for Product A exceeds even the maximum impeller diameter efficiency of Product B, a clear illustration of improved efficiency at cut down impeller diameters and enhanced Efficiency Islands.
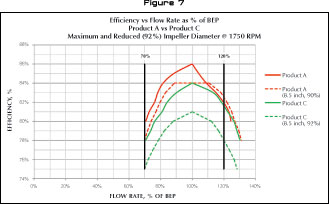
Figure 7 shows a similar example. Again, Product A efficiency at the cut down diameter is better than the maximum impeller diameter efficiency of Product C.
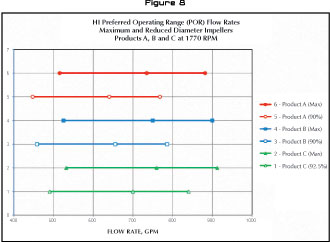
A comparison of the ANSI/HI POR (70 percent to 120 percent of BEP) for each of the pump sizes just examined is provided in figure 8. The maximum impeller flow range is shown along with the reduced impeller diameter flow range. Each line indicates data points for the 70 percent flow, the BEP flow and the 120 percent flow rate.
A more traditional view of flow versus TDH with efficiency is also provided in the next illustrations. Figure 9 shows Product A (in red) compared to Product B (in blue). There is very little difference in TDH versus flow rate for each unit. There is a sizable advantage to Product A when efficiency is compared at BEP and, more importantly, as one operates to the left or right of BEP.
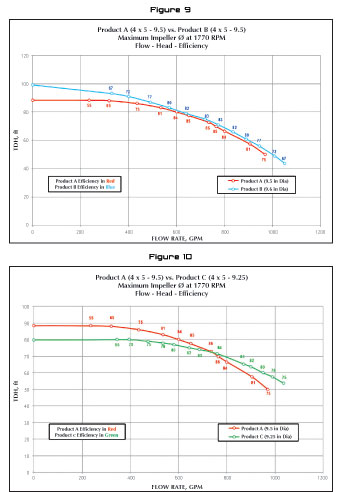
Figure 10 shows Product A (in red) compared to Product C (in green). There is some difference in TDH capabilities versus flow rate for each unit. Again, there is a sizable advantage to Product A when efficiency is compared at BEP and as one operates to the left of BEP. The different shape of the head capacity curve and the slightly different BEP design point are aspects of pump comparison which make it difficult to have a completely uniform comparison of products.
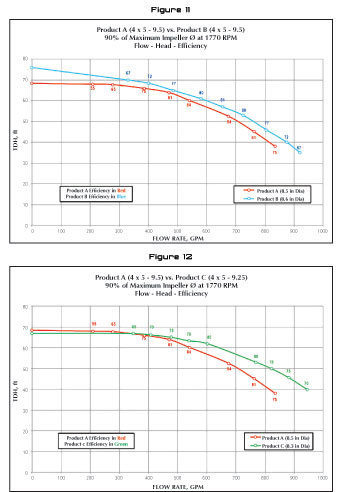
Figure 11 shows Product A (in red) compared to Product B (in blue) for a reduced diameter impeller (90 percent). The TDH variation is nominal versus flow rate for each unit. There is a substantial advantage to Product A when efficiency is compared at BEP and more importantly as one operates to the left or right of BEP.
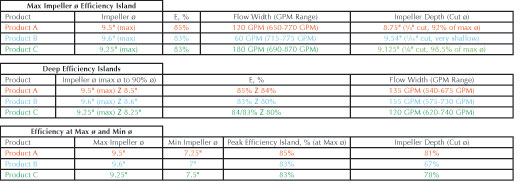
Figure 12 compares Product A (in red) to Product C (in green). The H-Q differences reflect different design approaches. The efficiency clearly reflects the advantage of Product A. Retaining high efficiency levels as the impeller diameter is reduced provides several advantages in addition to energy cost savings. With the higher efficiency levels it is sometimes possible to use smaller motors for non-overloading motor size requirements for either the constant speed or variable speed drive situations. Noise levels and mechanical loads are also reduced as the impeller diameter is reduced.
From another viewpoint, the following comparisons are examples of the wider Efficiency Islands (with respect to flow rate) and deeper Efficiency Islands (with respect to sustained efficiency at reduced Impeller diameters). Refer to figure 2 in part 1 of this series.
In the conclusion to this series, we will end by looking at control curves and variable speed operation, as well as an operating cost comparison for our three test cases. These comparisons reveal where the benefits of Efficiency Islands leave the testing areas and affect the bottom line.
NOTES
ASHRAE 90.1 – 2010 Energy Standard for Buildings
ANSI/Hydraulic Institute Standard 9.6.3 – 2012, Guideline for Allowable Operating Region
Simplified Analysis of Flow in Closed Loop Hydronic Systems, Bell & Gossett Technical Brochure TEH-802P, August 2001
Variable Primary Flow Systems, Bell & Gossett Technical Brochure TEH-910, 2010
ABOUT THE AUTHOR
Christopher S. Johnson is the global engineering manager for centrifugal pumps in Xylem Applied Water Systems in the commercial building and HVAC business unit, while also supporting the other business units with crossover products. He has held leadership roles in sales, application engineering, product management, global sourcing, global product development, and engineering.
_______________________________________________________________________
MODERN PUMPING TODAY, February 2014
Did you enjoy this article?
Subscribe to the FREE Digital Edition of Modern Pumping Today Magazine!