


Imagine a vibration transducer mounted close to the load zone of a bearing (see figure 1). Also imagine that when a rolling element passes a specific position on the outer race, a spectrum analysis is performed of the transducer output signal. The time frame on which the spectrum analysis is based is very short, catching only the exact moment when one rolling element passes the specific position.
MOMENTARY ENERGY DISTRIBUTION
In a healthy bearing, the signal is normally dominated completely by low frequency signals, such as unbalance, belt vibrations, misalignment and similar sources. Usually, there is also an extremely weak signal originating from the material interface between the rolling elements and the outer race. The small (microscopic) surface irregularities collide and emit weak elastic waves. These elastic waves are several magnitudes weaker than the low frequency signals. Since these elastic waves are very “sharp” (have short rise and fall time), they also contain energy in the high end of the frequency spectrum. One can say that it is like a “mechanical noise floor” in the spectrum.
Figure 2 illustrates a “snapshot” of a spectrum when a rolling element passes close to a vibration transducer in a healthy bearing. The pattern is normally dominated completely by low frequency signals (unbalance, misalignment and similar sources denoted 1X, 2X). A very weak broad band “mechanical noise floor” is illustrated in red. The ‘mechanical noise floor’ is lubrication dependent.
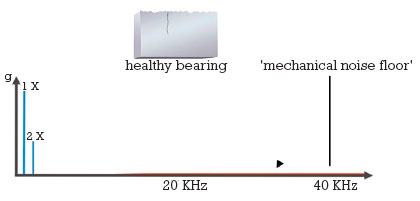
Figure 2: A snapshot of a spectrum when a rolling element passes close to a vibration transducer. In a healthy bearing, the “mechanical noise floor” is very weak.
In a Stage 1 bearing damage, when one or more microscopic cracks are widened the loading and unloading process—when the rolling element passes the area with microscopic cracks—creates elastic waves. The waves originate mainly from small surface collisions when the metallic parts are moving relative to each other (see figure 3). The energy content of these elastic waves is still very low in Stage 1, but measurable. The signal pattern still is completely dominated by the low frequency energy from unbalance and similar sources (denoted 1X, 2X), see figure 3.
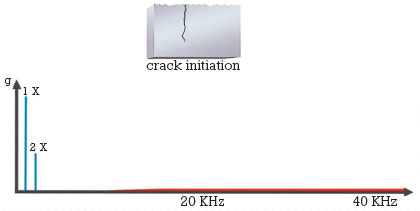
Figure 3: The “mechanical noise floor” has increased in Stage 1, and the signal pattern is still dominated by low frequency signals.
In a Stage 2 bearing damage (see figure 4), the microscopic cracks have formed a crack network. The loading/unloading process creates stronger elastic waves because there are now more semi-loose parts under the surface and the relative movement is greater. The “mechanical noise floor” has grown in the spectrum but is still weak. At this stage, the waves are strong enough to trigger the natural frequencies of the bearing assembly. The bearing natural frequencies depend on the dimensions of the bearing and how it is mounted. Typically, the natural frequencies can be found in the 2-6 KHz range.
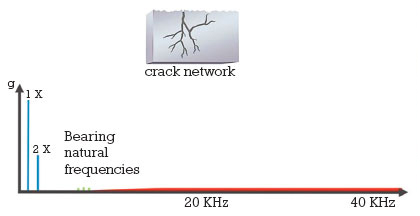
Figure 4: In Stage 2, the natural frequency of the bearing starts to show. The low frequency signals are still much stronger than the natural frequencies and the “mechanical noise floor.”
In a Stage 3 bearing damage, the crack network has caused bigger loose or semi-loose parts. Elastic waves are created from collisions between the rolling elements and the parts. The natural frequencies of the bearing are now stronger (because the elastic waves contain more energy) and the “mechanical noise floor” is peaking, see figure 5.
In Stage 4, the spalls have become big pits, and at the end of Stage 4 the sharp corners have all been worn down. The rolling elements are partly following the profile of the spalls, hence creating vibrations (not elastic waves) with a frequency corresponding to the bearing frequencies (BPFO, BPFI, BS, FTF).
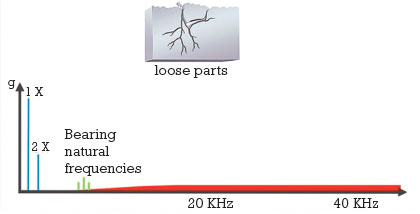
Figure 5: In Stage 3, the “mechanical noise floor” is elevated (red area) and so are the natural frequencies of the bearing.
With reference to the red spectrum lines (BPFO, BPFI) representing the bearing frequencies in figure 6: how is it possible to detect early damages in Stages 1, 2 and 3 if the bearing frequencies only show up in the spectrum at Stage 4? This is a common misconception. When a rolling element passes the damaged area in Stage 1, there is an increase in the “mechanical noise floor” every time it passes that specific position.
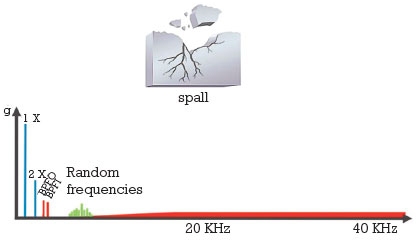
Figure 6: Clearly visible spalls. In the end of Stage 4, the rolling elements follow the spall shape, hence creating bearing frequency peaks in the spectrum.
By looking at e.g. frequencies above 10 kHz and measuring the occurrence frequency of the elevated noise floor, the bearing frequencies show up. Another way to describe this is by saying that the mechanical noise floor is modulated by the bearing frequencies.
For example, a machine running at 1500 RPM has a bearing with BPFO = 5.7. This means that one position on the outer race will see 1500*5.7/60 = 142.5 passes per second of a rolling element. This equals 142.5 Hz. The spectrum shown in figure 7 is a typical Stage 1 pattern in which the red mechanical noise floor will grow and weaken in strength 142.5 times per second. The 142.5 Hz is the occurrence frequency of the outer race signal.
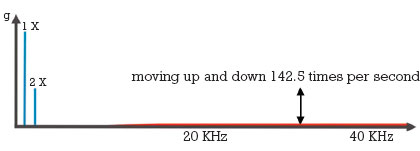
Figure 7: Bearing failure process Stage 1 in which the red “mechanical noise floor” will grow and weaken 142.5 times per second.
SUMMARY
When vibration enveloping was introduced several decades ago, it became possible to detect damages in earlier stages than before, and it then became relevant to talk about realistic pre-warning times. With vibration enveloping, it was possible to extract information coming from gears or bearings even if the transducer signal was dominated by low frequency content typically originating from unbalance forces.
Advances in vibration analysis technology is conservative, it takes a long time between the innovations. HD ENV Technology (HD = High Definition Enveloping) was introduced in June of 2015 on the global market. HD ENV applies HD technology to signals from standard IEPE compatible transducers (accelerometers).
HD ENV is a novel approach to the task of detecting gear and bearing deterioration in very early stages. By combining low noise hardware design and patented algorithms for digital signal processing with a standard vibration transducer, it is possible to extract relevant gear and bearing information from a noisy environment with exceptional clarity.
The main customer benefit of using HD ENV is the increased prewarning time for impact-related damages such as from gears and rolling element bearings. Another benefit is the ability to “see” gear and bearing related signals in complex machines. The accuracy of the method makes it possible to identify the signal of interest in an otherwise noisy environment with many signal sources. In situations such as these, standard vibration enveloping can fail while HD ENV provides meaningful results.
FOR MORE INFORMATION
Ron Kittle is managing director for SPM Instrument. SPM offers a wide product range from high-tech portable instruments to online systems and a comprehensive software. Our intelligent solutions are cost-effective, constructive, and complete. They make an excellent foundation for a proactive approach to maintenance, integrated in your normal maintenance activities and providing you with an overall picture. On your request, we will put together the monitoring equipment package best suited to your economic and technical requirements. For more information, visit www.spminstrument.com.
_______________________________________________________
MODERN PUMPING TODAY, July 2018
Did you enjoy this article?
Subscribe to the FREE Digital Edition of Modern Pumping Today Magazine!
![]()