All-Flo’s A200 pump reduces energy costs, improves performance | Part 1 in a 4-part series.
As you’re traveling at a speed of 500 miles per hour, at an altitude of 30,000 feet, you are probably very aware of the large amount of energy used during one flight and the fact that it is energy that drives our modern economy. It can be argued that today’s access to abundant and low-cost energy is a key ingredient to a thriving economy.
Over the last decade, the cost of energy has risen dramatically. According to the Bureau of Labor Statistics, the average consumer pays 47 percent more for electricity than they did ten years ago. Many producers and consumers are aware of this increase in energy costs and most have come to accept it as a necessary cost to do business in today’s economy.
In a modern manufacturing environment, energy is used in many forms including electrical, liquid fuels, hydraulics and pneumatics. For this discussion, we will examine air usage, particularly when used in air operated double diaphragm pumps (AODDP). AODDP are used in a variety of applications, but the most frequent usage is for a basic transfer application, a process that transfers fluid from point A to point B via positive displacement. During this process, AODDP consume energy in the form of compressed air and convert that energy into positive displacement, resulting in liquid transfer.
Before going any further into our discussion, we should agree on some assumptions. Though electrical rates vary widely across the globe, we will use the price of $0.07 per kilowatt-hour for all calculations throughout this article. Also, we will assume that, in an oversimplified manner, a 1 horsepower compressor can generate 4 SCFM of compressed air.
READING AN AODD PUMP PERFORMANCE CURVE
Knowing how to properly read an AODDP performance curve is essential to determining operating costs for AODDP. For a given operating condition, the pump performance curve is meant to convey two key pieces of information:
- The flow rate (GPM)
- The air flow rate (SCFM)
Each manufacturer’s performance curves look similar; the vertical axis represents pressure and the horizontal axis represents flow rate. Figure 1 shows the standard performance curve for a 2-inch (50.8 millimeter) AODDP, based on All-Flo’s legacy product design prior to making drastic improvements in the AODDP’s overall air consumption.
Identifying the operating conditions (the input pressure and liquid discharge pressure of the pump) is a necessary first step to reading a pump performance curve.
Typically, an AODDP sees no more than 20PSI liquid discharge pressure in a basic transfer application. An air input pressure of 80PSIG is common when using AODDP, though conditions vary. For this example, we will assume that a standard AODDP operates at 80PSIG air inlet pressure and the pump operates against 20PSIG liquid discharge pressure.
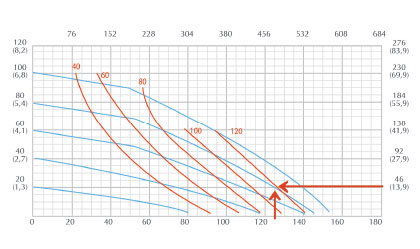
To read the curve featured in figure 1, start on the right side of the vertical axis at the 80PSIG air inlet line. If we follow the line until it intersects with the 20PSIG horizontal line, we find the operating point of the pump, 125 GPM at a cost of 118 SCFM.
CALCULATING OPERATING COST
With this information, we can derive the total cost for operating the pump during an eight-hour day, using the standard air compressor yield and cost of electricity. <
EXAMPLE:
Total Operating Cost
118 SCFM x 1 hp / 4 SCFM = 29. 5hp
29.5hp x 0.746kW/1 hp = 22.0 kw
22.0 kw x $0.07/1 kwhr = $1.54/hr
Based on these calculations and the assumed operating conditions, we can see that our pump costs $1.54 per hour of operation and assuming that the pump operates eight hours per day, five days a week, the pump costs $3203 to operate each year.
An operating cost of $3200 per year is typically more than the initial purchase price of a basic 2-inch (50.8 millimeter) AODDP. When you consider that some installations can operate more than 100 pumps, you then realize that the cost to operate these pumps can cost more than $300,000 each year. This substantial cost can, in some cases, represent more than the initial purchase price of the pumps.
A LOOK AHEAD
Energy is the engine behind all of our economic activity, but when confronted with rising energy costs, customers are left with few choices—raise prices or accept a lower profit in order to remain competitive. However, with AODDP, consumers have a third option, improving manufacturing techniques and equipment with a new All-Flo A200.
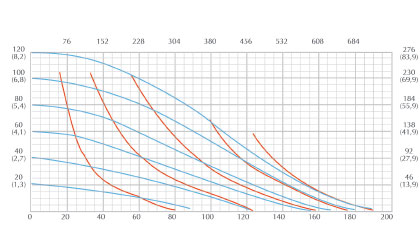
The performance curve featured in figure 2 is the standard performance for All-Flo’s new A200 pump model—we will be taking a closer look at the curve in part 2 of this series, revealing how the A200’s more-efficient use of space leads to better performance than traditional AODDP models. Also, in subsequent articles, we will evaluate air consumption of the new A200 model compared to typical other AODDP as well as highlight some real world applications where improvements in overall air-efficiency yield better bottom lines for those involved.
■ ■ ■
ABOUT THE AUTHOR
Paul McGarry is the All-Flo sales and marketing manager for North America. To learn more, visit www.all-flo.com, and www.aoddpumpefficiency.com.
MODERN PUMPING TODAY, March 2014
Did you enjoy this article?
Subscribe to the FREE Digital Edition of Modern Pumping Today Magazine!