Following a highly detailed study with its proven FreeFlowi4.0 (FFi4) pump monitoring equipment, optimization experts Riventa have identified annual savings of $303,000 for nine blowers that serve aeration lanes for Thames Water in England.
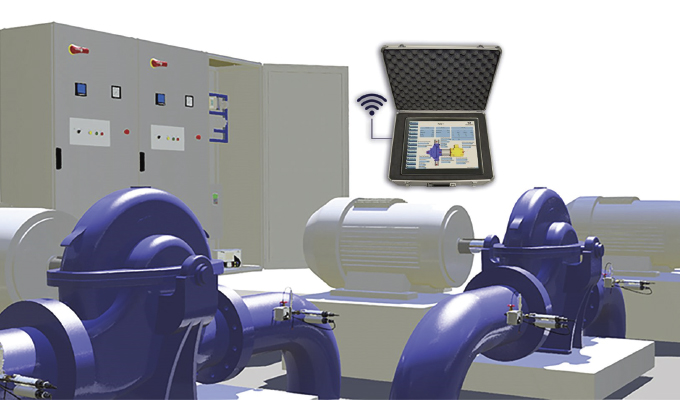
During a week-long exercise, the performance of each of the blowers was monitored using the thermodynamic technique, with measurements taken every five minutes for:
- Inlet and outlet pressures
- Inlet and outlet temperatures
- Electrical input power (taken before any inverter, if one present)
- Frequency downstream of any inverter, where applicable
From this, the following were calculated:
- Isentropic efficiency of the blower
- Total differential pressure rise across the blower
- Mass flow rate and volumetric flow rate
- Specific power requirements per unit of air volume
INSIDE THE THAMES WWTW
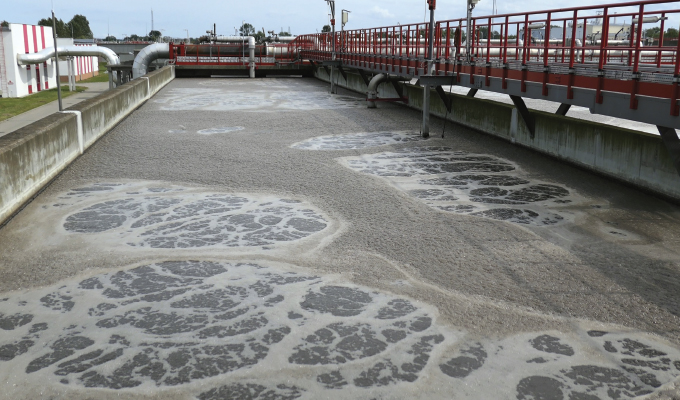
The Thames Wastewater Treatment Works operates in tandem with another site, as it takes the residual load within the catchment. As a result, there is a broad operating range, for which the aeration requirements need significant flexibility in blower output.
There are twenty aeration lanes (numbered Blowers 3 through 23) in use and seven operational blowers that serve a common header that supply them with air. The blowers are of centrifugal type, split into two different sizes: four at 355 kilowatts, 415-volt supply (Blower 4, on the 3.3-kilovolt system, is not used anymore and is out of service). There is a ninth blower, Blower 6, on the low voltage system, which is a high-speed turbo-type unit (285 kilowatts, 400-volt supply). This unit, however, has been recently installed and is still awaiting completion of final commissioning works. As such, it was not run at any time during the logging period and is not included in any of the following analysis.
All seven operational units have the ability of delivering variable flow rates individually through the use of their individual inlet guide vanes.
- Blowers 1, 2, and 3 (3,300 volts; 210 kilowatts), and Blowers 5, 7, 8, and 9 (415 volts, 355 kilowatts) all supply a common header that provides air at 450 to 500 millibar to twenty plug-flow type aeration lanes.
- Air flows to the lanes vary widely between 20,000 and 95,000 actual cubic meters per hour, a turn-down of almost 5:1.

RESULTS
All available blowers ran during the course of the logging period, with a wide range of operating flow rates required (20,000 to 90,000 actual cubic meters per hour), producing the need for solo operation to all seven blowers in parallel.
For 59 percent of the time, the blowers operate at more than 73 percent efficiency. The rest of the time is spent at efficiencies below 72 percent. This time includes operation during disruptive periods when there are planned change-overs from grid power supply to onsite generation. This shows that the site’s control of the process is relatively robust, with limited impact on overall average aeration performance. Interestingly, it is noticeable that when there is a reduction in efficiency, it coincides with the removal of one of the HV blowers from operation.
The blowers have to overcome the differential pressure in order to deliver the desired flow of air to the aeration lanes. There is a combination of frictional losses in the delivery pipework and diffuser head arrangement (as well as static pressure), due to the height of fluid above the diffuser heads.
In this case, the full range of operation of all the blowers was needed, providing a good relationship for the system pressure requirements for any flow. A static pressure of 445 millibar translates to an effective level in the lanes of 4.5 meters above the diffuser heads, and approximately 512 millibar required at the maximum flow rate (90,000 actual cubic meters per hour).
It is important to note that this system characteristic also encompasses all leakages and blockages—and any partially closed valves. It is known that a proportion of the diffuser heads have been identified for replacement in the coming months. Greater OTE (oxygen transfer efficiency) should occur with larger area of interface between air and liquor, reducing air demand per unit of BOD. The control valves will operate more within their optimum operating ranges (usually 30 to 70 percent open).
During the logging period there were 8 prevailing operating combinations (i.e., greater than 10 percent utilization) that constituted 77 percent of the total time run, all of which had average efficiencies of between 73.3 and 74.1 percent.
The most efficient blowers are Blowers 1 and 2 (at 80 percent each) and the least efficient is Blower 5 (at 67.5 percent). It should be borne in mind that as inlet guide vanes are closed, there is some sacrifice to efficiency. However, Blowers 1 and 2 can both achieve 80 percent efficiency—and so it is fair to expect that the other blowers, of the same manufacturer and type, should be able to achieve the same performance, through remedial works.
The electrical power for each unit of air or oxygen supplied to the aeration lanes has an average requirement of 0.018 kilowatt-hours per actual cubic. As air demand increases, so does the cost of oxygen supplied. Moving from the average flow to the most common operating conditions between six and seven blowers operating, there is an increase in specific power of 3.2 percent.
With clean lanes and new diffuser heads it would be expected that the mass of oxygen should reduce (for the same average biological load) as the oxygen transfer rate (OTR) increases through better bubble formation and distribution. It should be noted that OTR is related to the area of the interface between the liquid and the air. Smaller bubbles in greater density will address this.
Downstream, in each of the twenty aeration lanes, the dissolved oxygen (DO) is measured in two locations at progressively different parts of the aeration process. One important observation is that the DO readings appear high, given a set point expectation of approximately 2 milligrams per liter as a final output. High DO will mean considerable additional energy usage, because more air is supplied than needed. It can also have a negative impact on settlement of the sludge downstream, as natural flocculation is less effective.
There are no flowmeters on Blowers 1 through 3 but they are operating close to 13,000 cubic meters per hour each. It would be recommended that a flowmeter is added to the combined output of these three blowers (there is insufficient room to install a flowmeter on the discharge of each blower). This would allow the construction of KPIs (e.g., kilowatt-hours per cubic meters) for benchmarking purposes.
When the diffuser heads have been replaced in each specific lane, the control valves need to be addressed. Twenty-nine of the forty control valves are currently operating outside the recommended operational range of 30 to 70 percent, which means they will not be working effectively. This will be because of greater than expected flows downstream, possibly due to burst diffusers or leaks. Replacement of the diffuser heads will remedy this—and greatly improve the control of lane specific DO.
It is also noticeable that the guide-vanes are used where VFD’s could provide a similar effect (with some attention to the FDS and PLC logic used). This would have the advantage in that there would be only marginal change in isentropic efficiency, with a change in speed, yet the blower shaft power would be substantially less.
For the full range of flows measured over the logging period, and using a variable speed drive throughout—instead of inlet guide vane control—would give Thames Water a potential saving of $27,500, or 1.8 percent, per year.
Given the additional costs surrounding 3.3-kilovolt inverters, and the associated equipment, the costs to achieve this for Blowers 1 through 3 could be prohibitive. However, Blowers have a 250-kilowatt rating, and generally demand an electrical load of no more than 230 kilowatts. There could therefore be a comparison of 3,300-volt inverter retrofit to 415-volt electrical infrastructure replacement, making all equipment low voltage. This has advantages of its own: safer to operate, ease of spares, less costly to maintain—and lower initial capital cost.

REFURBISHMENT SAVINGS ANALYSIS
The original equipment manufacturer’s (OEM) performance curves were not available. However, it is fair to assume that the same efficiency should be expected of all of the Blowers. Blowers 1 and 2 both achieved an average 80 to 81 percent over the logging period—and both operated more than 95 percent of that time. If all the other blowers were able to achieve the same efficiency of 80 percent, this would give Thames Water a total saving of $120,000 per year.
With Blower 6 part-way through commissioning, it is evident that there is a perceived advantage in choosing a turbo-type blower over the existing centrifugal types. It is recommended that before further replacement occurs, the post-refurbishment performance is verified; thus, providing an alternative to the introduction of further new technology.
Hybrid-type blowers will provide larger turn-down ratios of 3:1 relative to the much narrower performance of the centrifugal types. However, there is a trade-off with a lower efficiency of maximum 75 to 77 percent. Turbo-type units have a narrower turn-down (max 2:1) but a higher peak efficiency (82 percent)—although efficiency falls away either side of its best efficiency point. Purchase and maintenance costs also tend to be higher than hybrid or the status quo.
With all seven of the current blowers running, the total load was at most 1,710 kilowatts (at isentropic efficiency 74.2 percent, drive efficiency 91.5 percent). Blower 6 is rated as 18,000 cubic meters per hour for 285 kilowatts (Pshaft). The maximum flow of 92,000 cubic meters per hour seen over the logging period would thus need five units like Blower 6—and would demand 1,546 kilowatts for a similar air flow, constituting a potential 10 percent saving to existing; 10 percent of the current energy bill is $153,000.
FOR MORE INFORMATION
Steve Barrett is managing director for Riventa. Riventa has a long track record delivering highly innovative technology and is committed to working with the best project delivery partners across the globe and focused on achieving great results for its customers. The Riventa team of pump energy experts includes highly skilled hydraulic engineers, software developers, engineering consultants, business managers, contract specialists, and project managers. For more information, visit www.riventa.com.
MODERN PUMPING TODAY, August 2022
Did you enjoy this article?
Subscribe to the FREE Digital Edition of Modern Pumping Today Magazine!


