


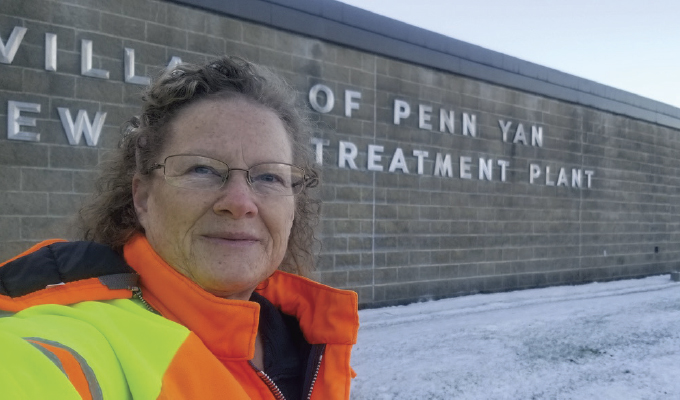
Located on the north end of Keuka Lake in the state of New York is the village of Penn Yan, which is home to approximately 5,000 people. The Keuka Lake Outlet carries water from the lake’s outlet through the Village along with flow from two small creeks to Seneca Lake, the largest lake in the Finger Lakes chain. These waterways and the power they generated were a principal reason for the establishment of the Village on this site in 1799. Today, residents and summer vacationers enjoy many recreational activities along the lakes and outlet. Protecting these waterways is a top priority for the Penn Yan Wastewater Treatment Plant operations team, and the chief operator, Yvonne Tucker.
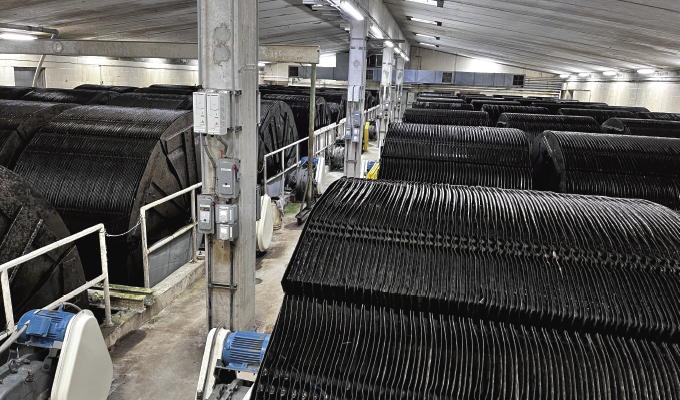
The village wastewater treatment plant was built in 1983 with a design flow capacity of 1.8 million gallons per day. For the most part, the plant runs well, however during heavy rain events, flows can increase from the average 1.2 million gallons daily flow to 5.6 million gallons per day in less than thirty minutes causing inflow/infiltration issues. The secondary treatment process is comprised of 16 rotating biological contactors (RBC), two-stage anaerobic digestion, mechanical screw press dewatering, and biosolids compost production. Nitrification takes place on the last ten RBCs, and polyaluminum chloride is utilized for total phosphate reduction to less than 1 mg/L. While industry accounts for about 10 percent of the plant’s flow, periodic dumping can cause overloading that upsets conditions resulting in the need for an increase in phosphorus removal.
Monitoring the treatment of Penn Yan’s wastewater from influent to effluent involves the collection of a lot of data as pollutants are removed and water quality is restored. Operators receive some data such as pH, dissolved oxygen, suspended solids, temperature, etc. from instruments, and also receive water quality results from samples sent to laboratories. In addition, plant operators used paper bench sheets that were later entered into an Excel spreadsheet for performance tracking. Prior to continual monitoring, all the lab results, instrument readings, and bench sheets were manually entered into different spreadsheets for different tracking purposes. The problem with entering data manually is that it is very time-consuming and is prone to human error.
Having data stored in different spreadsheets for different reasons is not optimal when it comes to understanding the dynamic performance of a system as a whole. “We were chasing data all over the place in multiple spreadsheets which made it very hard to troubleshoot issues and difficult to see long-term trends,” says Tucker.
MOVING TO AN AUTOMATED CENTRALIZED DATA PLATFORM
Penn Yan moved from paper to digital in 2022 with Rio, a software program by Aquatic Informatics that helps manage treatment plant operations by collecting and organizing data into actionable insights. The new software can integrate with electronic lab transfers, pull data from instruments, and allow personnel to capture field data on-site with a connected mobile device. Alerts can be set to notify operators with in-app notifications and email if a parameter setpoint has been exceeded.
Having all this data securely stored in the cloud improves operational visibility. Preceding and following weekends and holidays, operators will let their co-workers know if something is amiss or a little unusual, but sometimes circumstances don’t allow for the conversation to happen. Having information from the previous shift at the fingertips of the new crew ensures they can have a quick glance at the previous eight hours.
TROUBLESHOOTING WITH DATA
Like most wastewater treatment plants, Penn Yan has redundancy at their pump stations. Equalling out pump run-times is important to ensure maintenance is performed when it should. If there is a deviation in pump run times, it can indicate a problem.
“We recently installed a new pump station and began to notice that one of the pumps was accumulating more hours than the other,” says Tucker. “On investigation, our team determined that the T-joint on the pipe had come apart so that when that pump was on, water was coming back into the wet well so it had to pump longer than the other one. By monitoring and trending pump hours in Rio, we were able to identify there was a problem.”
Having all this information live in one platform gives operators a much better understanding of performance and if any changes need to be made to the system to keep wastewater flowing through the treatment process efficiently.
For example, if the load cells for the rotating biological contactors (RBCs) on one train indicates a trending increase in weight, and the other train load cells do not show an increase, this type of one-sided increase would indicate an uneven flow or loading condition. This would require an adjustment to the splitter box ahead of the RBC process to even out, or balance the distribution between the two trains. If left uneven, this could result in reduced treatment efficiency, or possibly increased stress on the mechanical equipment due to an overweight condition which could result in catastrophic failure.
A leading indicator of a healthy digestor is the ratio of volatile acids to alkalinity (VFA/TA). The Penn Yan treatment plant operates around 0.12. The anaerobic digestion process can be finicky, if the pH has changed, then it’s too late, and the bacteria have stopped functioning. This can result in a sour digestor, and possibly foaming issues. “Using Rio we can watch this ratio trend closely and adjust how much we are feeding the digestor or add alkalinity to buffer the acid if needed,” says Tucker.
Ensuring equipment is operating within its capacity and that operational processes are running efficiently impacts both short-term costs (maintenance and repair) and long-term capital budgets.

GARNERING INSIGHTS WITH VISUAL ANALYSIS
Being a relatively small treatment plant, Penn Yan monitors around 100 parameters from regulatory influent/effluent parameters to process control data. The new platform allows Tucker to select and analyze any number of these parameters, over any period. Prior to using Rio, she had to pull data from multiple spreadsheets to compile reports, which was time-consuming. Now with a few clicks, she can create graphs and dashboards to visualize trends or identify relationships between any number of parameters.
Tucker says, “We can create the graphs we need, on-demand, 10 times faster now—it’s a huge time-saving feature.”
As summer approaches, Penn Yan population swells resulting in an increase in organic loading, often resulting in an alert that clarifier sludge blanket heights are too high. Operators can now look at historical data to see when this usually happens and what they did to accommodate the change.
“We can now be more predictive—we can avoid some problems and investigate others quickly and easily, so we can improve our response time to fix them in the future.”
REPORTING, COMPLIANCE, AND TRANSPARENCY
Tucker uses Rio to produce the monthly NetDMR discharge reports and other quarterly reports for stakeholders. As most data is automatically fed into the system, compliance reporting takes a lot less time, and without additional, repetitive data entry, there is less chance for human error. Having all the derived data in one place adds a layer of defensibility to reporting, but it is also helpful when a permit exceedance occurs.
When a permit violation occurs, the village needs to follow protocols which starts with notifying the Department of Environmental Conservation (DEC). Tucker explains, “The next step is to understand why we had a violation, so we go through the plant looking for problems. We check the operation of chemical metering pumps, make sure we are adding enough chemicals to help with settling, compare the industry flow to see if their contribution is causing a negative impact, look at what is in the influent, and check to ensure that the flow did not exceed the design parameters of the tank, and so on. Having all this data in one place, allows us to easily and visually see the whole process. We can overlap data to compare time periods and determine what happened so we can get back in compliance.”
Prior to the new software, if a stakeholder asked to see the last year of flow data, it would involve pulling data from twelve different spreadsheets and copying and pasting it into one. This was time-consuming work that may, or may not, garner any valuable insight. Today, Tucker can select and organize the data she needs for just about any request, providing a new level of transparency for stakeholders and the ability to provide reports that visually showcase pertinent results.
CAPTURING HISTORY FOR FUTURE HIRES
Small communities with small budgets are held to the same standards and regulations as larger water utilities. “It’s vital for small teams like us to use every tool we can to streamline operations and work processes, as our roles and responsibilities often encompass a more diverse spectrum than our colleagues in larger utilities,” says Tucker.
As new hires join the team, they need to quickly get up to speed on plant operations. Having all its wastewater treatment information stored in one place will really help with this. As things change over time, operators will have a reliable historical baseline to help with decision-making.
FOR MORE INFORMATION
Scott Dorner is data management product manager for Aquatic Informatics. Aquatic Informatics provide ongoing support and training for newly released features through regular software updates, ensuring that utilities get the most out of their data with the constant evolution of technology. For more information, visit www.aquaticinformatics.com.
MODERN PUMPING TODAY, May 2024
Did you enjoy this article?
Subscribe to the FREE Digital Edition of Modern Pumping Today Magazine!