Organizations establish standard product development processes to proactively optimize performance versus profit. However, the impact of insufficient quality or reliability are dealt with reactively and often late in the development process. The primary objective for evidence-based modeling is to transition from process measurement to control, by minimizing defect/lesson recurrence through early detection/correction with accountability for prevention directed to affected functional groups. This allows each to improve its procedures, tools, and training based upon documented and validated evidence.
The model dictates that each organization has development and corrective processes operating in parallel across the product lifecycle. Each contributes metrics that measure an organization’s reputation, i.e., profit versus value.
The corrective process continually documents, validates, corrects, and communicates lessons. It identifies the need for strategic tools to short-cycle functional silos that deter agility through the delay of functional bureaucracy. Evidence shows that the parameters of the value metrics tie results to the capability of functional groups instantiated to develop products.
The initial results of applying Evidence-based practices and value driven metrics were presented to a Department of Defense (DoD) working group as value-added for DoD contractors (see note 1). However, evidence-based practices are equally applicable to any organization developing products.
The following presents the value proposition in terms of what experience has shown are significant points to consider when the goal is to improve engagement and agility by transitioning from process measurement to control.
ORGANIZATIONAL ENGAGEMENT
Managing evidence to quantify Value metrics impacts the organization’s structure and engages employees across the organization. Kotter states that a value-proposition is to be understood and supported by as many as 75 percent of the organization’s executives (see note 2). Evidence-based Organizations (EbO) defines “value-added” from a top-down perspective, while Evidence-based Product Support (EbS) presents the upward value of a mathematical, process, and tool driven approach to controlling product performance while improving performance, processes, and agility (see note 3).
THE MODEL
The goal is to establish a structured methodology for maturing the organization and realizing the benefits of a closed-loop business model that ties centers-of-functional-excellence to the organization’s value-metrics. Value metrics measure functional performance, quality, and reliability, which enables targeted process improvement and the creation of strategic development tools to breakdown the communication barriers (silos) inherent in process-driven organizations (see note 4). The methodology categorizes defects based upon the physical and process attributes of failure to measure quality and reliability contiguously across the product lifecycle.
COMMUNICATIONS AND EXPECTATIONS
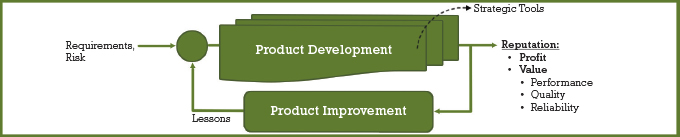
Figure 1 presents the EbS model for organizational maturity. The product development cycle is redefined as a simple closed loop system. Purposefully defined value metrics are key to achieve long-term performance, quality, and reliability goals. Value metrics are defined with parameters that are observable, reachable, and controllable from within the organization.
The Input–Collect external requirements and assume the risks of creating or evolving a product to provide customer value.
The Value Metrics–Provide statistically optimized initial quality and long-term reliability to satisfy the customer and the organization.
- Customer value generally relates to time and cost dependent functions to develop products that:
- 1. operate in all desired modes of operation,
- 2. are easily repaired if failed, and
- 3. have replacement parts available and deliverable to a desired location with minimal delay.
- Organizational value is provided through controlling the probability of a field escape given corrective decisions made (or not made) during product development.
Product Development—Functional groups operate in parallel during product development. Strategic tools break down the “silos” created by deficiencies attributable to intra-organizational social networks.
Product Improvement Via Correction–Each product team periodically meets to discuss the issues related to product improvement. Objectives include:
- 1. detect, document, classify, and validate defects,
- 2. define root cause and corrective action for identified trends,
- 3. map, then disseminate product and process lessons to their points of escape, and
- 4. identify the need for strategic tools necessary to ‘sew’ together the disparate outcomes across functional silos.
Closing the Loop–Product teams independently execute the Corrective process for their given products. The Corrective process, however, is standardized and managed from a central function with goals that are independent from those of Product Development. The loop is closed through a system of three levels of equations.
The first level defines counting processes that normalize defects across the product lifecycle. A second layer combines legacy results with current manufacturing results to:
- 1. project risk and reliability for new products and,
- 2. provide measurement of functional capability for the functional processes instantiated to develop products.
The development of the third layer is on-going. It combines results to form a Bayesian belief network that systematically predicts the probability of a field escape based upon decisions make during design, manufacturing, and field maintenance.
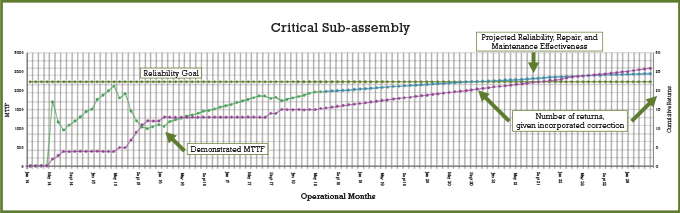
Value Metric Example–Figure 2 shows an example of a value metric, representing a departure from standard reliability growth projections. Non-homogeneous algorithms work in parallel to:
- 1. track defects based upon failure modes derived from the repair process,
- 2. mix reliability of the failing defect population with the reliability of modified replacements,
- 3. quantify the expected sub-population size via binomial sampling, and
- 4. project operational hours into the future.
Proprietary parameters enable quality and reliability to be controlled via corrections incorporated at the lowest levels of assembly. Results are then automatically rolled-up across sub-assemblies to project product improvement over time.
Strategic Tools–Strategic tools provide automated data entry, analysis, and results reporting. Thus, providing alignment of core competencies and requirements for functional training (see note 5). At completion, each employee can quantify the contribution its function brings to the organization based upon that function’s ability to learn and prevent defects from escaping to the customer.
CORRECTIVE AND PREVENTIVE TOOLS EMERGE FROM THE CORRECTIVE PROCESS.
Corrective Tools–Provide the product team with four attributes of value:
- 1. to perform “what if” testing to control/optimize value metrics for their product,
- 2. feed lessons back to the organization’s processes via a mapping of defects to the Organization’s process tree.
- 3. define requirements for Preventive tools.
- 4. utilize observable, reachable, and controllable parameters to know where each product is relative to (a) performance, reliability, and quality; (b) how they got here based upon previous decisions; and (c) where they will be based upon future decisions.
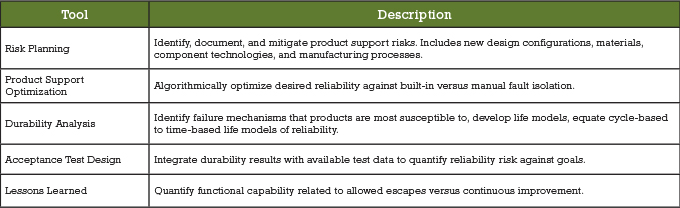
Preventive Tools—A stated objective of the corrective process is to drive previously identified risk out of product development and dissolve functional silos. Table 1 provides examples of tools developed to integrate functions associated with product support, design, and manufacturing across the product lifecycle.
CONCLUSION
A structured model is presented that has two paths. The development path creates products while a corrective path improves the products and processes instantiated to develop those products. Value metrics are defined with parameters tied to the capability of the organization’s functional groups. Control groups manage corrective action to completion while strategic tools dissolve functional silos. Preventive and corrective tools measure each function’s capability to learn and correct functional deficiencies. The closed-loop process enables individual participation with contributions measurable at the product and functional levels within the organization.
NOTES
- 1. Bill Winkel, Payam Motabar, “The Emergence of Evidence-based Product Support,” July 25, 2018, DoD Industry Working Group, PowerPoint presentation. Presentation available upon request.
- 2. John P. Kotter, “Leading Change: Why Transformation Efforts Fail,” Harvard Business Review, May-June 1995: pages 1-14.
- 3. “Product support” is defined as functional core competencies related to quality, reliability, maintainability, logistics, and safety.
- 4. A “silo” is defined as a social boundary that stifles communication between two or more functional groups. They are inherent in cost and schedule constrained product development activities.
- 5. Strategic tools are those developed internally to provide proprietary functions not provided by the commercially available third-party tools.
William B. Winkel, B.S. electrical engineering, M.S. reliability engineering, has over thirty years of experience in the field of evidence-based engineering and corrective processes. The experience has spanned multiple industries to include automotive, commercial, and national defense. He provides consulting services to companies seeking to enhance and implement strategies to ensure and quantify success. For more information, visit www.ebo-co.com or email william.winkel@ebo-co.com.
MODERN PUMPING TODAY, May 2019
Did you enjoy this article?
Subscribe to the FREE Digital Edition of Modern Pumping Today Magazine!