In the conclusion to this series, we will examine the testing results for organic and combined corrosion inhibitors in both hard and soft water utilizing mild steel corrosion coupons and instantaneous electrochemical corrator analysis. As you will see, it is possible to design a greener solution that does not sacrifice performance or increase usage cost.
HARD WATER
Initial testing was performed on synthetic high hardness water (Note: For the composition of this water, reference Table 6 in part 3 of this series, which appeared in the March 2015 issue of Modern Pumping Today).
Corrosion Coupons
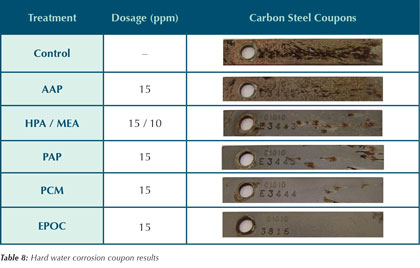
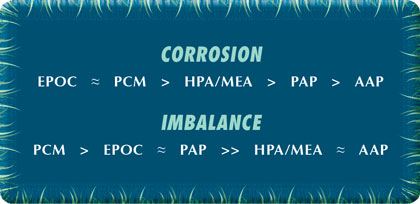
Due to the shortened five day exposure time of each trial, coupon analysis was limited to qualitative observations. The results, shown in Table 8, provide a visual comparison between corrosion inhibitors. Under the test conditions outlined in the experimental procedure, the carbon steel inhibitor performance can be ranked as seen in chart 1.
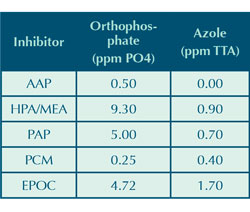
Under test conditions, residual orthophosphate and azole levels were measured at the conclusion of each five day test. Results are shown in Table 9. There was little phosphate in the system at the start of each run and any orthophosphate at the end was due to the reversion of organic phosphonate to orthophosphate. The azole level at the beginning of each run was 3 parts per million. The reduction of azole is due to its susceptibility to oxidation under higher sustained ORP levels (see reference 4). The AAP that was used contained a small amount of phosphate resulting from the manufacturing process.

Table 8 shows that both the AAP and control coupons have been plated with copper and Table 9 shows that the AAP test has no residual azole after five days. This is a strong indication that the 3 parts per million azole in these systems has been degraded by the hypochlorous acid additions. Once the azole is depleted, there is nothing to protect the copper corrosion coupon. The copper released from its corrosion readily plates on the surface of the mild steel coupon. The other inhibitors in Table 8 do not show this copper plating. It is the belief of the authors that the AAP is more susceptible to oxidation than the other organic inhibitors, which creates a higher demand of hypochlorous acid. Control of hypochlorous acid addition was based on free chlorine, not total chlorine. Hence, it is possible that the AAP run used more chlorine than the other inhibitors, potentially leading to higher chlorides and a faster azole degradation rate.
Reversion of an organic phosphate inhibitor to orthophosphate represents a change from an organic program toward an inorganic program, which could affect the overall green status of the program or its performance. Orthophosphate is not as good at inhibiting mild steel corrosion as organic phosphate, especially at low levels (see reference 8). Performance of an orthophosphate program may be reduced due to increased scaling potential of calcium phosphate, which could introduce new mechanisms of corrosion such as under deposit corrosion (see reference 9). This can be addressed by lowering the pH or increasing the phosphate dispersant polymer, however this can often be difficult to control.
Changes in the ratio of organic phosphate to orthophosphate can also introduce system testing errors and control difficulties that can lead to an increase in the total phosphorous in the system. More phosphorous in a water system can lead to increased fish mortality caused by eutrophication, algae growth, and loss of oxygen.
Minimizing the loss of azole in a system is also beneficial to the green status of an inhibitor because azole is known to increase the aquatic toxicity of an inhibitor (see reference 10). For a system that loses azole due to oxidation, more must be fed to maintain yellow metal corrosion protection, possibly increasing the overall toxicity of the system water.
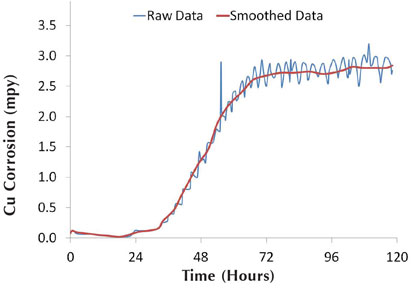
Figure 6: Graphical smoothing of data
Although the system containing EPOC shows the least deterioration of azole, the reversion of organic phosphate to orthophosphate was quite high. Conversely, PCM shows minimal reversion to orthophosphate, but coincides with a high loss of azole in the system. HPA/MEA and PAP coincided with less azole deterioration than PCM, but this may be due to the higher ratio of total chlorine to free chlorine provided by the amine functionality of these inhibitor combinations. Even though MEA was added to the HPA to minimize reversion to orthophosphate, the reversion over the five day test period at continuously elevated oxidation levels was substantial.
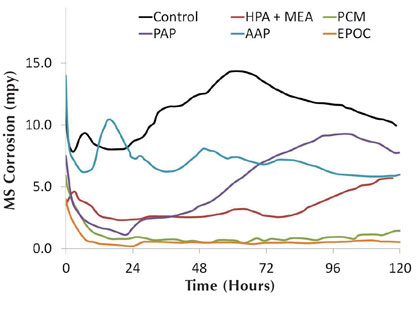
Figure 7: Hard water mild steel corrosion rates for organic inhibitors
Corrator Analysis
This type of corrosion analysis yields graphical results that provide a quantitative representation for the full five day test run. The two-channel corrator output provided continuous results on general corrosion and the pitting potential, which is called the imbalance (see reference 11). Addition of oxidizing biocide led to large variability in the data sets. Graphical smoothing of the data was performed for ease of comparing the different corrator data sets. Examples of the raw and smoothed data are shown in figure 6. The raw data shows the copper corrosion spikes corresponding to hypochlorous acid additions.
Figures 7 and 8 show the organic inhibitor mild steel corrosion and imbalance rates, respectively, for the synthetic hard water system. The corrator results agree well with the corrosion coupon observations, with EPOC showing the best overall corrosion inhibition and PCM showing the best imbalance rate. Rankings for the mild steel corrosion and imbalance rates are seen in chart 2.
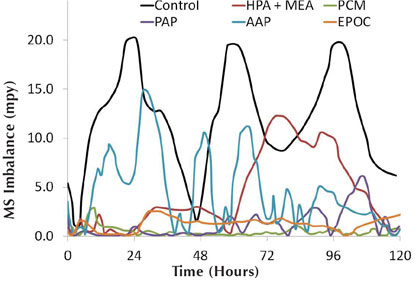
Figure 8: Hard water mild steel imbalance rates for organic inhibitors
Binary combinations of organic inhibitors were also investigated in this work. In one example, the apparent combinative effect of AAP and PAP was observed. While AAP and PAP performed modestly as individual mild steel corrosion inhibitors over the course of the five day test, figure 9 shows there is a combined positive effect of having both inhibitors in the system. Table 8 shows each inhibitor, AAP and PAP, was tested at a concentration of 15 parts per million as active product. For the combined inhibitor testing, the total treatment concentration was held constant. Hence, AAP and PAP were each added to the system at a concentration of 7.5 parts per million as active product.
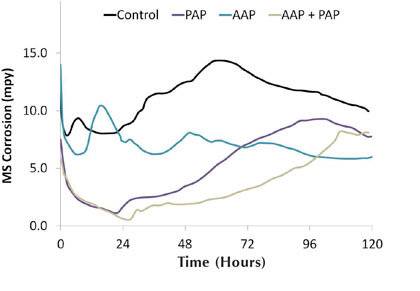
Figure 9: Hard water mild steel corrosion rates for combined inhibitors
Copper corrosion rates can also be improved when treating with combinations of organic inhibitors. Figure 10 shows the effect of adding both AAP and PAP to the system at a concentration of 7.5 parts per million as active product for each inhibitor. The sharp spikes observed at 24 hours are a result of increasing the ORP set point by 100 mV. Each inhibitor starts the test with a corrosion rate below 0.5, but rises to 2.0 by the end of the five day test. The combined inhibitor, however, sustains a corrosion rate below 0.5 for the entire duration of the run. It should be noted that each run, including the control, had a background level of 3 parts per million tolyltriazole added at the start of the test (as seen in Table 6 in part 3 of this series). As previously discussed, this again shows the susceptibility of azole degradation under oxidizing conditions.
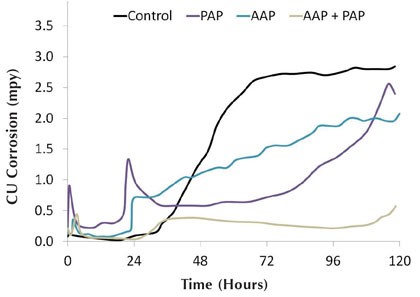
Figure 10: Hard water copper corrosion rates for combined inhibitors
SOFT WATER
Secondary testing was performed on synthetic low hardness water (Note: For the composition of this water, refer to Table 7 in part 3 of this series, which appeared in the March 2015 issue of Modern Pumping Today). The aim of this testing was to compare a traditional soft water open recirculation treatment against a greener option, both of which are shown in Table 10. Both inhibitors programs, as well as the control, were used at a dosage rate of 150 parts per million. Hence, the values listed in Table 10 are the active ingredient concentrations in the system at a dosage rate of 150 parts per million.
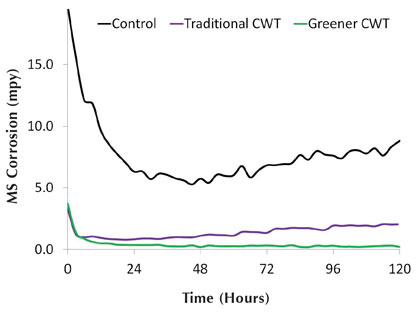
Figure 11: Soft water mild steel corrosion rates
The greener option was constructed based on the results from the hard water testing discussed previously. Although there is an increase in the total organic phosphorous of the product, it was thought that the reduction in zinc and removal of molybdate makes the overall product greener than the traditional open recirculation treatment program. Table 10 also shows the traditional treatment program is 40 percent more costly than the greener option, although this was not the goal in developing the greener product.
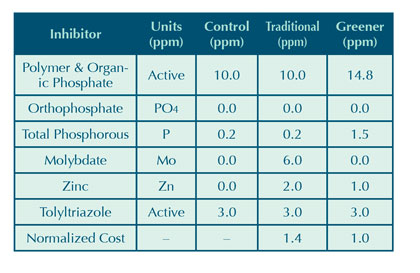
Table 10: Active concentrations of soft water corrosion inhibition programs
Corrosion Coupons
Table 11 shows the mild steel corrosion coupons for the synthetic soft water system. The control coupon for the soft water system does not have the same copper plating shown in the control coupon for the hard water system. This is likely an artifact of the higher amount of hypochlorous acid used in the hard water control test. The higher amount of oxidant deteriorates the azole faster, which leads to higher copper corrosion. The free copper in the system then plates the mild steel corrosion coupon. A lesser amount of continuous chlorination was used in the soft water simulation as the investigation to a greener product choice was narrowed. The free and total chlorine levels during this testing were at 0.25–1.0 and 0.75–1.5, respectively, to simulate a relatively well-controlled cooling water system found in field conditions.
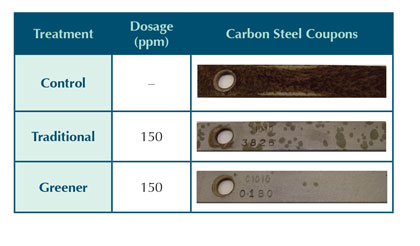
Table 11: Soft water corrosion coupon results
Corrator Analysis
Figure 11 shows mild steel corrosion rates under the synthetic soft water conditions for the two different treatments. As before, corrosion rates match up well with qualitative corrosion coupon observations. Figure 12 shows the copper corrosion rates for these inhibitors, which also agrees with the results shown in figure 11 that the greener treatment performs better than the traditional treatment. Along with Table 11, figures 11 and 12 demonstrate that moving toward greener alternatives for open recirculation treatments does not necessarily lead to sacrificing inhibitor performance or increasing usage cost.
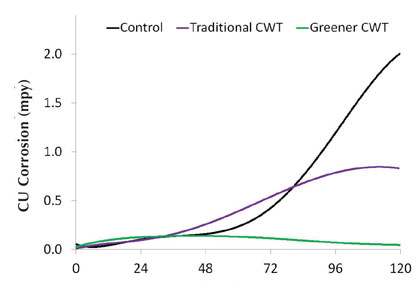
Figure 12: Soft water copper corrosion rates
CONCLUSIONS
A pilot test apparatus is capable of screening potential corrosion inhibitors and combinations of inhibitors to move toward greener products. This may include reducing the concentration of less desirable ingredients, eliminating certain ingredients altogether, or even combining ingredients in new ways to take advantage of combinative effects. All inhibitors tested provided some level of carbon steel corrosion protection, even under the conditions of high continuous oxidation provided by sodium hypochlorite. Under the experimental conditions, PCM and EPOC performed the best at inhibiting mild steel corrosion as single component inhibitors. There is an apparent combinative effect provided by combinations of certain inhibitors, as was shown for AAP and PAP, particularly in the inhibition of copper corrosion.
Copper plating unto mild steel becomes more prevalent as the concentration of oxidant increases and the level of azole copper inhibitor diminishes. Reducing the oxidation degradation of azole and other inhibitor components is important in seeking greener product offerings because this can reduce the total amount of inhibitor used while still maintaining good scale and corrosion protection. This work has shown that under pilot conditions, it is possible to design a greener soft water make-up product that does not sacrifice performance or increase usage cost. More work is necessary to further compare pilot results with field trials. ■
REFERENCES
- M. LaBrosse and D. Erickson, “The Pursuit of a Green Carbon Steel Corrosion Inhibitor,” The Analyst Technology Supplement, Fall (2012). Training Manual, 2nd ed., chapter 4, section 5.10.6 (2009).
- H. Van Droffelear and J.T.N. Atkinson, Corrosion and Its Control: An Introduction to the Subject, 2nd ed., chapter 2, page 25-26 (1995).
- K.M. Given, R.C. May, and C.C. Pierce, “A New Halogen Resistant Azole (HRA) for Industrial Water, Paper IWC-98-60 (1990).
- H. Van Droffelear and J.T.N. Atkinson, Corrosion and Its Control: An Introduction to the Subject, 2nd ed., chapter 6, page 98-100 (1995).
- B.J. Marston, H.B. Lipman, and R.F. Breiman, “Surveillance for Legionnaires’ Disease: Risk Factors for Morbidity and Mortality,” Archives of Internal Medicine, 154, 2417-2422 (1994).
- B.P. Boffardi, “Corrosion and Fouling Monitoring of Water Systems,” The Analyst Technology Supplement, Spring (2010).
- Association of Water Technologies Technical Reference and Training Manual, 2nd ed., chapter 4, section 5.10.1 (2009).
- H. Van Droffelear and J.T.N. Atkinson, Corrosion and Its Control: An Introduction to the Subject, 2nd ed., chapter 2, page 33-35 (1995).
- D.L. Hjeresen, “Green Chemistry and the Global Water Crisis”, Pure and Applied Chemistry, 73, 1237-1241 (2001).
- Rohrback Cosasco Systems, Inc., “Model 9020 &9020-OEM Corrater Transmitter User Manual,” November (2004).
About The Author
Matthew LaBrosse, PhD, is an engineer in research and development at U.S. Water Services, Inc. in St. Michael, Minnesota, and can be reached at mlabrosse@uswaterservices.com. Donovan Erickson is a certified water technologist for U.S. Water Services, Inc. The authors wish to thank the Association of Water Technologies for allowing this series to be presented and to U.S. Water Services for the resources necessary to conduct the research. For more information, visit www.uswaterservices.com.
MODERN PUMPING TODAY, April 2015
Did you enjoy this article?
Subscribe to the FREE Digital Edition of Modern Pumping Today Magazine!


