


Building on last month’s installment in this series, this article will detail the simulated cooling tower water experiment’s test procedure for both a scaling and corrosive environment. Also, we will provide visual reference and figures illustrating general corrosion rates. Later installments will build on these observations to determine acceptable green corrosion inhibitors for use in open system cooling waters by examining the effect of oxidizing biocide on their performance and, finally, to select the most appropriate and cost effective product for use as a green corrosion inhibitor.
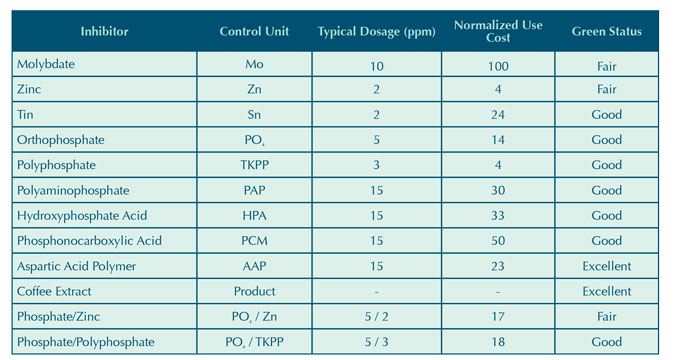
Table 2: Synthetic water quality used in all trials.
EXPERIMENTAL PROCEDURE
The test apparatus consisted of a circulation loop with the return water line aerated before entering the sump. This provided the necessary oxygen to simulate cooling tower water. The flow rate was 7.0 gallon (26.5 liter) per minute in 1 inch (25.4 millimeter) clear PVC piping for ease of visual inspection. This corresponds to a linear velocity of 3.2 feet (1 meter) per second. This is in the range of accepted flow rates for corrosion coupon racks (see reference 12). The temperature for each run was maintained at 95 degrees Fahrenheit (35 degrees Celsius); the heat was provided by the main circulation pump and booster pump. Synthetic water was used to simulate both a scaling and corrosive environment. The synthetic water quality is shown in Table 2. Scale was controlled during each run by the addition of active 1-hydroxyethane-1,1-diphosphonic acid (HEDP) and a phosphate/iron dispersant copolymer (AA/AMPS). The active amounts of scale inhibitors are shown in Table 2. The equilibrium pH for each run was 8.7 to 8.9. This was the natural result of the amount of synthetic bicarbonate alkalinity added, the temperature, aeration, and test run duration.
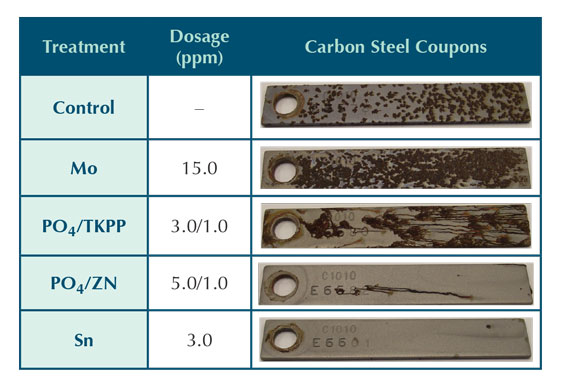
Table 3: Inorganic inhibitor corrosion coupon results.
New carbon steel coupons and corrator tips were used for each run. All coupons and tips were not passivated prior to an experimental run. Each test consisted of a five day run at which time pictures were taken of the carbon steel coupon and corrator data was graphed. A copper coupon was also installed in the loop for each run to provide a source of potential free copper to more closely simulate a mixed metallurgy cooling water system. Tolyltriazole was added to the system to minimize corrosion of the copper coupon. This was done to further mimic field conditions. No other metallurgy was present in the system; all fittings were schedule 80 PVC. The system was cleaned between runs with citric acid and rinsed thoroughly. The rating of an inhibitor was determined by the appearance of the coupon, the corrator graphs, the green status, and the use cost.
RESULTS AND DISCUSSION
Coupon Analysis
Due to the shortened five day exposure time of each trial, coupon analysis was limited to qualitative observations. The results, shown in Table 3, provide a visual comparison between corrosion inhibitors. Under the test conditions outlined in the experimental procedure, the carbon steel inorganic inhibitor performance can be ranked as follows:
Sn ≈ PO4/Zn >> PO4/TKPP > MoO4.
The relatively poor performance of the molybdate and phosphate/polyphosphate could be attributed to an ineffective low dosage. It is also possible that the inhibitor did not provide both anodic and cathodic protection under the test conditions. The molybdate coupon appeared worse than the control coupon that had no adjunct corrosion inhibitor added beyond what may have been provided by the HEDP and copolymer shown in Table 2. The tolyltriazole present in each trial may have also provided some minor protection for carbon steel either by limiting free copper in the system or as a complimentary carbon steel corrosion inhibitor.
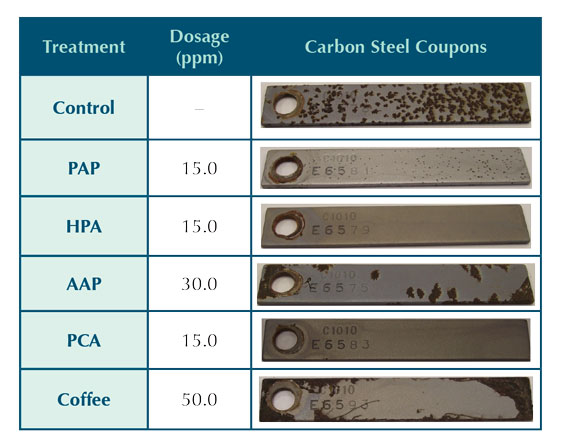
Table 4: Organic inhibitor corrosion coupon results.
Table 4 shows corrosion coupons for the organic carbon steel corrosion inhibitors. The qualitative performance under the conditions tested can be ranked as follows:
HPA > PCA >> AAP ≈ PAP > Coffee.
The HPA provides excellent carbon steel corrosion protection under the conditions tested. There is no evidence of general corrosion or pitting on the corrosion coupon. The PCA run also provided excellent corrosion inhibition of carbon steel. Another inhibitor tested was aspartic acid polymer. AAP is not typically touted as carbon steel corrosion inhibitor, but is known for its scale inhibition properties. AAP provided some carbon steel protection in the testing. The dosage for this inhibitor was intentionally tested at twice the manufacturer recommended rate due to the lack of documentation of using AAP as a carbon steel corrosion inhibitor. Further testing is needed to observe AAP performance at recommended dosage. The carbon steel corrosion coupon from the coffee extract trial shows a significant amount of surface corrosion. This inhibitor has the poorest qualitative results of the organic inhibitors.
The appearance of the corrosion on the coupon run using PAP was different than the appearance of the coupon tested with AAP. The PAP coupon appeared to have more of pitting type corrosion, although it was not severe. PAP results are discussed more in depth with the evaluation of the corrator results.
If the inorganic and organic inhibitor results are combined, the carbon steel inhibitor performance under the conditions tested based on corrosion coupon analysis was:
HPA > PCA > Sn ≈ PO4/Zn > AAP ≈ PAP > Coffee > PO4/TKPP > MoO4.
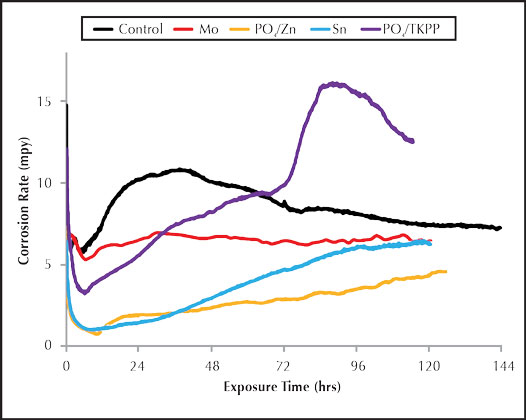
Figure 1: Inorganic inhibitor corrosion rate.
Corrator Analysis
This type of corrosion analysis yields graphical results that provided a quantitative representation for the full five day test run. The two-channel corrator output provided continuous results on general corrosion and the pitting potential, which is called the imbalance.12 As with the coupons, the molybdate and phosphate/polyphosphate inhibitors provided the least mild steel corrosion protection under the conditions of the test and the inhibitor dosages used, as can be seen in Figure 1. Tin exhibited similar corrosion results to the phosphate/zinc inhibitor. They both started with low carbon steel corrosion rates around 1.0 mpy, but the corrosion rates gradually increased over the five day trial.
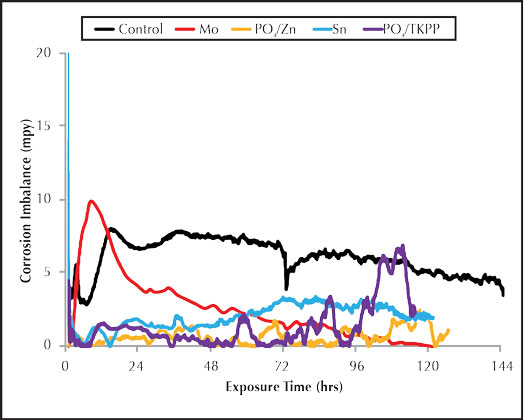
Figure 2: Inorganic inhibitor imbalance rate.
Figure 2 shows the corrosion imbalance for the inorganic carbon steel corrosion inhibitors. The phosphate/polyphosphate saw a large increase in the pitting corrosion during the end of the test run. This trend was also observed for phosphate/polyphosphate in Figure 1, indicating a poor overall performance. The molybdate imbalance was high during the initial part of the run but decreased toward the end, indicating high pitting potential for the first twenty-four hours. The general corrosion was relatively high for the duration of the run. This is consistent with the severe general corrosion observed on the corrosion coupon surface. Both the tin and phosphate/zinc trials produced similar corrosion and imbalance results, but the phosphate/zinc appeared to provide less pitting potential.
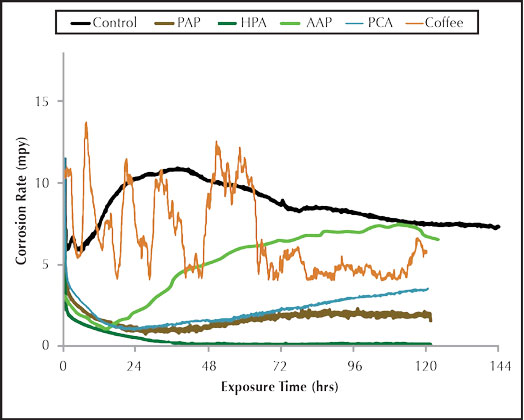
Figure 3: Organic inhibitor corrosion rate.
Figure 3 shows the general corrosion rate for the organic carbon steel corrosion inhibitors. AAP provided corrosion protection for carbon steel as compared to the control, but the corrosion rate steadily increased over the five day trial. PAP exhibited excellent general corrosion protection with the rate staying at or below 2.0 mpy for the duration of the trial. The HPA shows superior general corrosion inhibition as compared to all other inhibitors.
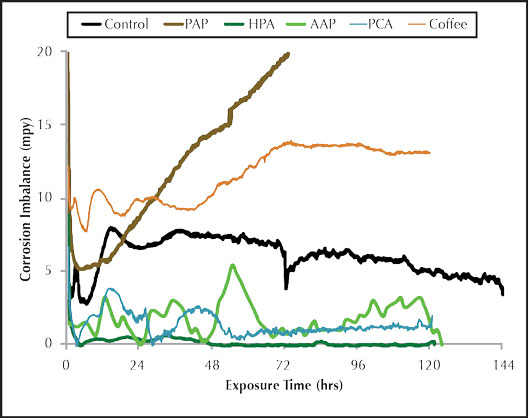
Figure 4: Organic inhibitor imbalance rate.
Figure 4 shows the imbalance for the organic corrosion inhibitors. There is some pitting potential observed for the AAP. As was the case with the general corrosion graph, the HPA exhibits superior pitting inhibition over all the inhibitors tested. The PAP corrator results provided an interesting and definite contrast between the general corrosion and imbalance rates. The PAP general corrosion in Figure 3 was good, second only to the HPA, but the pitting potential in Figure 4 appeared to be the worst of all the inhibitors tested. The imbalance output steadily increased until it exceeded the maximum measuring limit of 20 mpy. This is consistent with the PAP carbon steel corrosion coupon, which shows evidence of several pitting corrosion sites on the surface. Additional testing is required to determine the repeatability of that observation. PAP may also require a co-inhibitor to provide better overall anodic and cathodic protection for carbon steel. The combined results of the inorganic and organic inhibitors tested under the conditions tested based on corrator analysis are listed below. The PAP was not ranked in the corrator performance due to the unexplained imbalance results and pending further testing.
HPA > PCA > PO4/Zn ≈ Sn > AAP > PO4/TKPP > MoO4 >> Coffee.
Table 5: Comparison of corrosion inhibitor green status (from Table 1) to its use cost. The use cost has been normalized to an arbitrary value of 100.
Based on the Green Chemistry criteria defined in this research, aspartic acid polymer and coffee extract ranked the most green, as can be seen in Table 1 and Table 3. They are followed by tin, phosphonocarboxylic acid, hydroxyphosphonic acid, and polyaminophosphonate. Finally, orthophosphates, polyphosphates, molybdate, and zinc were considered the least green. If phosphate-free status is mandatory then polyaspartic acid and tin would be the green inhibitors of choice.
CONCLUSIONS
All inhibitors tested provided some level of carbon steel corrosion protection. Under the experimental conditions, HPA was the best carbon steel inhibitor tested as shown by both the qualitative coupon results and quantitative corrator analysis. The corrator results compare nicely with the coupon results based on the ranking for each corrosion analysis method. Comparison of the normalized use cost of the inhibitors clearly shows that molybdate is not an effective inhibitor for mild steel at reasonable cost when used alone in a cooling tower. The inhibitors considered most green and phosphate-free are aspartic acid polymer and tin. Their use cost is approximately 30 percent higher than a normal phosphate/zinc program. This makes them a potentially acceptable choice in the pursuit of a green carbon steel corrosion inhibitor. Further testing is required including field testing to expand the scope of corrosion inhibitors investigated and verify pilot results in field trials. Further testing is also necessary to examine the effect of oxidation on the corrosion inhibitors and explore potential synergistic effects of combining carbon steel corrosion inhibitors. ■
REFERENCES
- Report on Carcinogens, Twelfth Edition, National Toxicology Program, Department of Health and Human Services, 2011. Web. May 17, 2012.
- Qishlaqi and F. Moore, “Statistical Analysis of Accumulation and Sources of Heavy Metals Occurrence in Agricultural Soils of Khoshk River Banks, Shiraz, Iran,” American-Eurasian J. Agriculture and Environmental Science, 2, 565-573 (2007).
- J.T. Huber, N.O. Price, and R.W. Engel, “Response of Lactating Dairy Cows to High Levels of Dietary Molybdenum,” Journal of Animal Science, 32, (1971).
- B. Oram, Water Research Center, B. F. Environmental Consultants Inc., 2012. Web. May 17, 2012. “Phosphates in the Environment.”
- Association of Water Technologies Technical Reference and Training Manual, 2nd edition, chapter 5.10, (2009).
- P. Puckorius et al., “Phosphonates-Part II-Corrosion Control- Cooling Water,” A Practical Guide to Water Treatment Chemicals Newsletter, Volume 2, Issue 1, 1st quarter (1998).
- P. Howe, M. Wood, and P. Watts, “Tin and Inorganic Tin Compounds,” Concise International Chemical Assessment Document, 65, World Health Organization Geneva, (2005).
- J. Fawell and R. Mascarenhas, “Inorganic Tin in Drinking-water,” Background document for development of WHO Guidelines for Drinking-water Quality, World Health Organization, (2004).
- W.E. Stapp and G. Westlund, “Corrosion Inhibition Compositions and Methods for Using the Same,” U.S. Patent 7,910,024, issued March 22, 2011.
- V.V. Torres et al., “Inhibitory Action of Aqueous Coffee Ground Extracts on the Corrosion of Carbon Steel in HCl Solution,” Corrosion Science, 53, 2385-2392 (2011).
- B.P. Boffardi, “Corrosion and Fouling Monitoring of Water Systems,” The Analyst Technology Supplement, spring (2010).
- Rohrback Cosasco Systems, Inc., “Model 9020 &9020-OEM Corrater Transmitter User Manual,” November (2004).
About The Author
Matthew LaBrosse, PhD, is an engineer in research and development at U.S. Water Services, Inc. in St. Michael, Minnesota, and can be reached at mlabrosse@uswaterservices.com. Donovan Erickson is a certified water technologist for U.S. Water Services, Inc. The authors wish to thank the Association of Water Technologies for allowing this series to be presented and to U.S. Water Services for the resources necessary to conduct the research. For more information, visit www.uswaterservices.com.
MODERN PUMPING TODAY, February 2015
Did you enjoy this article?
Subscribe to the FREE Digital Edition of Modern Pumping Today Magazine!