

In order to effectively rate the successful treatment of the force main, a background against which to make a comparison must be provided. In this instance, the municipality had used the same third party testing service to quantify H2S emissions from MH1 and 3. The baseline data, provided from June 30 – July 8, July 12 – 22 at MH1 and July 15 – 21, 2011, at MH3, does not occur immediately before the MDU test, but is recent enough to provide a good representation of the potential H2S levels present in these manholes. The OdaLog charts for these dates are included below, figures 1 – 3 are for MH1 and 4 – 6 for MH3.
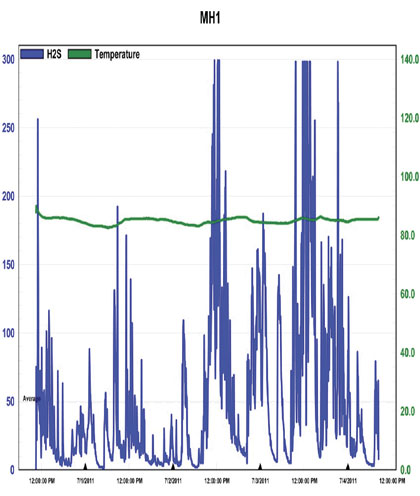
Figure 1: Baseline H2S Concentrations at MH1, 6/30 – 7/4/11

Figure 2: Baseline H2S concentrations at MH1, 7/4 – 7/8/11
The first thing that should be noted is that in each chart there is significant “clipping”, as indicated by the plateau’s that occur at the peak values on each chart. This indicates that the H2S concentrations were outside the detection limit of the instrument, meaning that actual values were likely higher. Ignoring this clipping, the highest value provided for background H2S concentrations was 417 parts per million and occurred at MH1 multiple times over the date range 7/7 – 7/12, as shown in figure 3. The highest value recorded at MH3 is 347 parts per million and occurs on 6/30, as shown in figure 4.
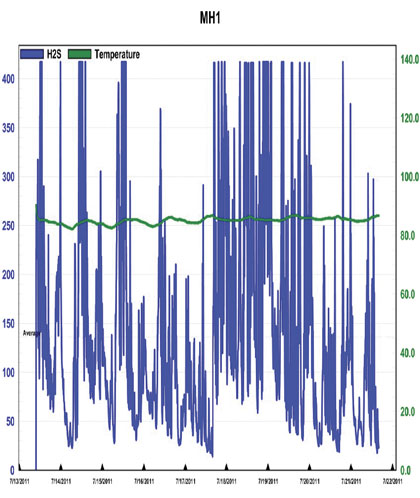
Figure 3: Baseline H2S Concentrations at MH1, 7/12 – 7/22/11

Figure 4: Baseline H22S Concentrations at MH3, 6/30 – 7/4/11
What is also shown in this data is the general nature of the systems behavior at this point in time. The wide range of concentrations covered within a very short period appears similar to the oscillations typically associated with an uncontrolled system. Variations to system conditions, such as in flow or wastewater chemical composition, yield a clear response, rather than maintaining a quasi “buffered” state with apparent stability within the environment, which would be indicative of overall system health. Due to the clipping it is hard to know exactly how extreme the concentrations are, but they are at least above 200 parts per million throughout the entire system and definitely reaching levels above 300 parts per million at MH1. These are levels which can present the risk of respiratory irritation as well as more severe threats to human health and they are being achieved on a regular basis while under chemical treatment. In additional to odor and health risks, these concentrations present a significant risk of infrastructure corrosion.

Figure 5: Baseline H2S Concentrations at MH3, 7/4 – 7/8/11
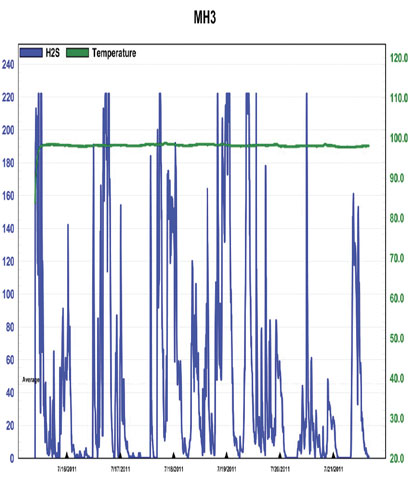
Figure 6: Baseline H2S Concentrations at MH3, 7/15 – 7/21/11
Figure 7 is from an OdaLog placed by AWT in MH1 and shows a small section of H2S concentrations prior to system activation, as well as the effect of the MDU treatment.
The concentrations recorded between August 17 and 18 present and even more illuminating picture of the H2S generation potential in this portion of the collection system. The maximum and average values were recorded as 3469 parts per million and 343 parts per million, respectively. There was a heavy rain event that occurred over night between August 18 and 19 that is likely responsible for the extreme spike above 3400 parts per million, but the concentrations preceding this spike are realistic and quite elevated; typically in the 500 – 1500 parts per million range, and up to 2000 parts per million. This also supports the suspicion that the third party OdaLog units were reaching detection limits very quickly and were not indicating the full extent of actual conditions.
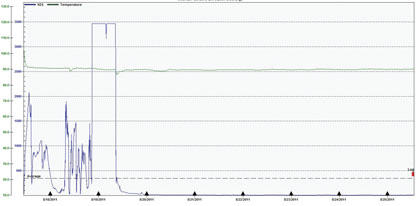
Figure 7: OdaLog H2S concentrations Prior to and During Treatment at MH1, 8/17 – 8/25
The system was turned on around 1:00 PM on August 18. From figure 7 it is apparent that approximately twenty-four hours later the H2S concentration begins an extreme decline that ends at less than 10 parts per million, where it stays the remainder of the test period. Detention time for this 2 mile stretch of force main was calculated to be twenty-five hours, which is in direct agreement with the OdaLog data.

Figure 8: H2S Concentrations Prior to and During Treatment at MH1, 8/17 – 8/25
As confirmation of these results, OdaLog data from the third party’s sampling is shown in figures 8, 9, and 10.
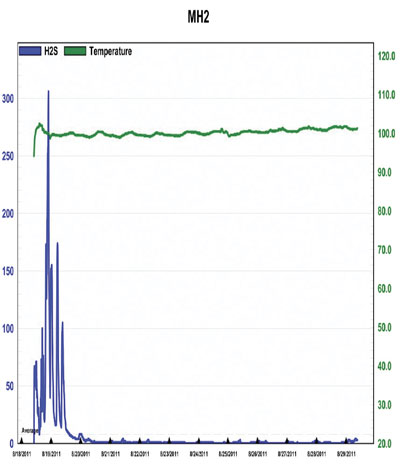
Figure 9: H2S Concentrations Prior to and During Treatment at MH2, 8/17 – 8/25
With the exception of the data out of range for this OdaLog, figure 8 behaves very similarly to figure 7, providing confirmation that the extreme drop that started in the middle of the day on August 19 is realistic and that the treatment was able to significantly and consistently decrease H2S concentrations. Again, by the end of the test, H2S had stabilized at less than 10 parts per million. There is some discrepancy between figures 7 and 8 in the rate at which this decrease happened, and the reason for this is unknown at this time. It may have had to do variances in saturation and subsequent rate of desaturation of the sensors on the two individual OdaLog units. The following two figures, 9 and 10, undergo a very similar pattern and rate of decline as that shown in figure 7, which provides some indication that the rate of decline was greater than what is implied by figure 8 alone.
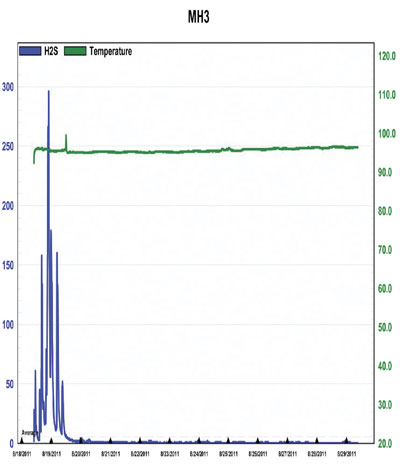
Figure 10: H2S Concentrations Prior to and During Treatment at MH3, 8/17 – 8/25
Figures 9 and 10, from MH2 and 3, again show very similar reduction trends to figure 3; a peak followed by a steep, continuous drop to less than 10 parts per million, in about a day. Grab samples were collected concurrently, the results of which are shown in figure 11.

Figure 11: AWT Grab Sample Results, MH1
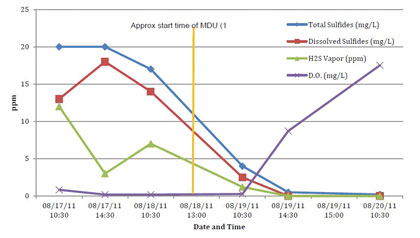
Figure 12: Third Party Grab Sample Results at MH1
AWT collected grab samples while a technician was in the field, through August 20. These results are shown in the figure 11 above as well as table 3. Figure 12 and table 4 contain the grab sample results from the third party.

Table 3: AWT Grab Sample Results at MH1 and System Status
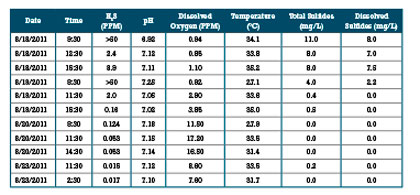
Table 4: Third Party Grab Sample Results at MH1
CORRELATION OF VAPOR TO LIQUID GRAB SAMPLES
Total and dissolved sulfides represent the liquid phase precursor to H2S gas. By monitoring these values for reductions, we can verify treatment of the source is taking place, rather than simply a reduction in experienced odor. For example, at a pH of 7, H2S is approximately 50 percent of the dissolved sulfide value, at pH 6 it is approximately 90 percent. By ensuring the source is being treated, the effectiveness of the treatment system is better established and it can be better assured that the detrimental effects of sulfide compounds are being actively prevented.
Both sets of the liquid grab samples have a high correlation, in terms of data trends, with the vapor phase data taken from the OdaLog units. In both tables above, there is a definitive decrease in H2S, total and dissolved sulfides. A desirable inverse relationship of increasing DO levels to decreasing sulfide levels is also evident. The results from all these tests arrive at the same conclusion, indicating that the liquid phase infusion of ozone and oxygen into the force main was able to very effectively induce a significant reduction to H2S and sulfide levels as well as increasing the DO to well above the point where the environment within the force main would be considered aerobic.
DISCUSSION
Figure 13 below is a “zoomed-in” view of the data that was collected by AWTs OdaLog prior to the infusion process showing an effect in the force main that allows a more representative view of untreated system conditions.
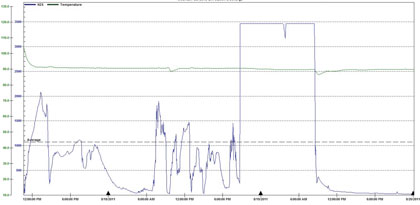
Figure 13: AWT OdaLog Data Immediately Prior to System Effect, 8/17 – 8/20
As we have already seen, H2S levels were very elevated. The average H2S indicated on figure 13 is 1070 parts per million and even if the extreme spike above 3000 parts per million is ignored, the average concentration is still about 700 parts per million. After treatment, concentrations as low as 1 parts per million were achieved; however, for calculation purposes a more realistic average is 7 parts per million H2S, based on OdaLog values following the steep drop, which were considered treatment induced values. This equates to a 99 percent reduction in H2S levels in a matter of days, with real results starting in about a day, as shown in figure 14.
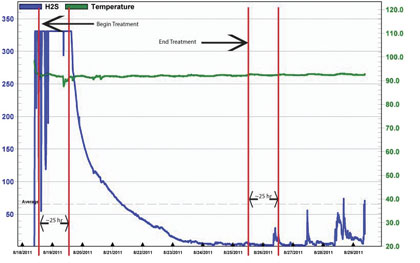
Figure 14: Third Party OdaLog H2S Concentrations and Response Times
This is the same chart that was shown as figure 4, but now includes some interesting time data. The start up of the system is clearly indicated as well as the calculated detention time range, approximately twenty-five hours. What should be noticed from this chart is how the H2S concentration begins a rapid descent almost exactly at this twenty-five hour mark (14a). Additionally, the system shut off is included in this chart and about twenty-five hours later, the H2S levels begin to experience peaks again. When AWT returned to disconnect the system, it was discovered that there was an impingement on the gas feed line and infusion (treatment delivery rate) had significantly decreased. This could be one explanation for the fact that it took slightly less than twenty-five hours for the increase in concentrations to resume following the system deactivation.
Another very important fact that must be pointed out is that, although the H2S concentration does begin to increase following system deactivation, as would be expected, the peaks are only in the 25 – 80 parts per million range. And they stay there for at least four days, which is all the data available. This is very significant as ten days prior the untreated H2S concentrations had been spiking, at times, in excess of 1500 parts per million, and suggests that the environment within the force main is directly affected by the infusion of oxygen and ozone in a positive manner.
A LOOK AHEAD
In next month’s installment, we’ll conclude this series by illustrating the detailed benefits of sustainable treatment gases in wastewater collection systems. ◆
Anue Water Technologies is a privately owned, U.S. company dedicated to providing innovative solutions for improving the processing and treatment of water and wastewater. Anue serves the global market with a network of sales representatives and service providers to actively support applications development, leading to optimized solutions—working with municipalities, wastewater operating and industrial companies who encounter challenges with wastewater, to create tailored, highly effective solutions for treating odor and corrosion. For more information, visit www.anuewater.com.
____________________________________________
MODERN PUMPING TODAY, September 2017
Did you enjoy this article?
Subscribe to the FREE Digital Edition of Modern Pumping Today Magazine!
![]()
Odor and Corrosion Control in Wastewater Collection Systems: Part 4 of 5
