Last month, we introduced the following study, which consisted of three phases that started in the autumn of 2016 at a site located in Egypt by the Red Sea. Results from this study are presented in three phases, as they were performed and analyzed. Preliminary tests were conducted on the U.S. West Coast to observe and compare the behavior of CMF versus MMF in seawater filtration. Three sampling points were studied: common inlet (raw seawater), CMF outlet, and MMF outlet.
RESULTS
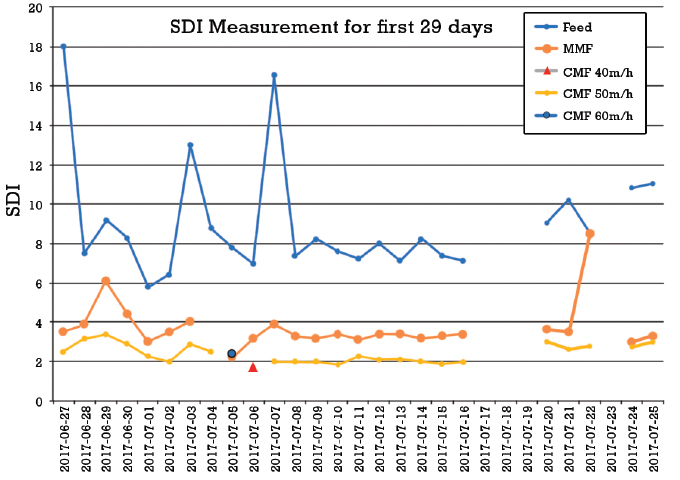
Typical values are presented hereafter of the fouling rate, average silt density index (SDI) and laser particle counts. The following curves represent the typical fouling rate measured for raw seawater, MMF outlet, and CMF outlet. The curves indicate a longer time to foul the membrane with CMF compared to MMF. This is based on the measured fouling rates, where the SDI was calculated for all samples.
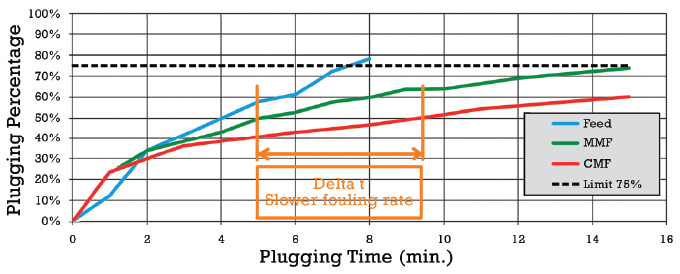
Graph 1: Typical Rate of Plugging Comparison—MMF vs. CMF
The study was conducted with two side-by-side SWRO trains sharing a common open sea intake. Based on a well-documented methodology the Fortex Experts and Vortisand team had three objectives in mind:
- Measure the field performance of CMF in comparison to existing multi-media filtration (MMF) pretreatment systems.
- Observe and measure the impact of two different pretreated water qualities via silt density index (SDI) and levels of turbidity.
- 3Determine the impact and ROI in relation to operating costs, water recovery, cleaning frequency, chemical consumption, power cost, feed pressure, and backwash volume.
SDI CALCULATION
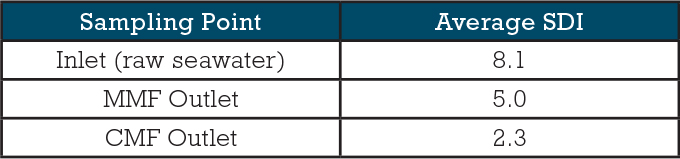
Based on fouling rate measurements, the SDI was calculated for each sampling observation. The average SDI calculated for CMF treated water indicates a significantly lower value than the average value calculated for MMF.
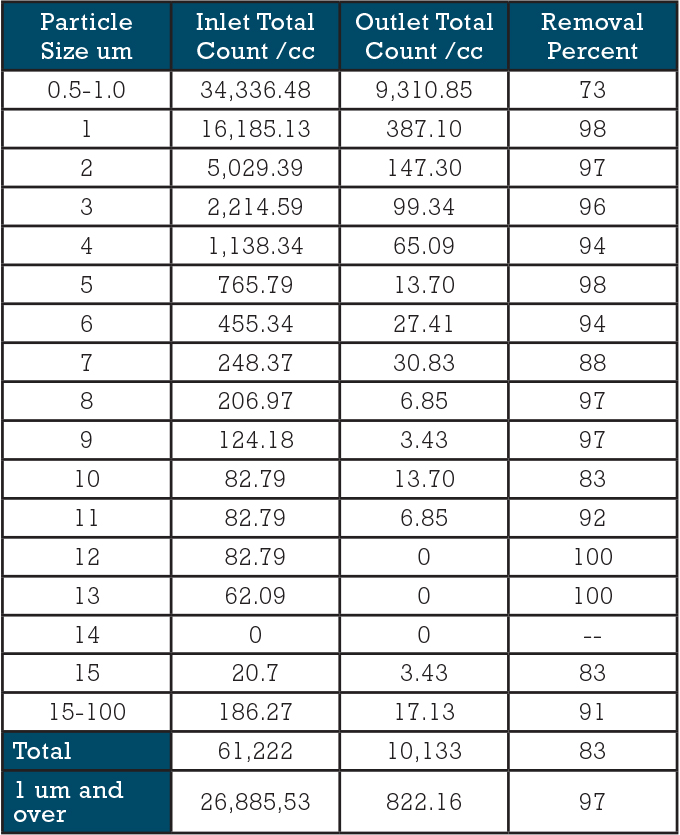
LASER PARTICLE COUNTS
Table 6 presents particle count analysis data for the CMF train. The total particle count of the particles between 0.5 to 100 micrometers is 61,222 at the inlet of the filter, with turbidity at 4.6 NTU. The particle count at the outlet of the filter is 10,133 with a turbidity of 0.23 NTU.
The water quality coming out of the CMF system indicates 73 percent removal of particles smaller than 1 micrometer, 83 percent removal of particles between 0.5 and 100 micrometer, and 94 percent removal of particles between 1 and 15 micrometers.
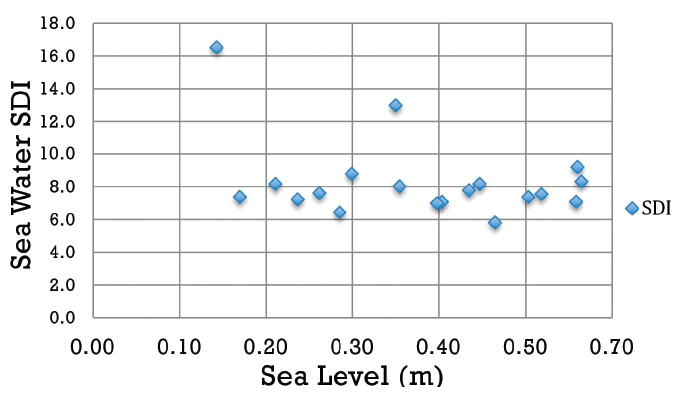
Phase 1 started in June 2017 to determine the optimal filtration rate and performance of CMF. As planned, CMF pretreatment was operated to compare three different incoming flow rates. The open seawater intake is 1.5 meters deep, 30 meters away from the beach, and 600 meters from the plant. After investigation, SDI variation was important but clearly not only related to the tides.
Seawater SDI was measured most of the time between 6 and 9. The highest value of SDI was measured at 18 units, during the lowest sea level and at the time when the tide started to rise again. The nature of water intake and the embarkation are also very important factors in raw water SDI variation.
IN SEARCH FOR OPTIMAL FILTRATION RATE
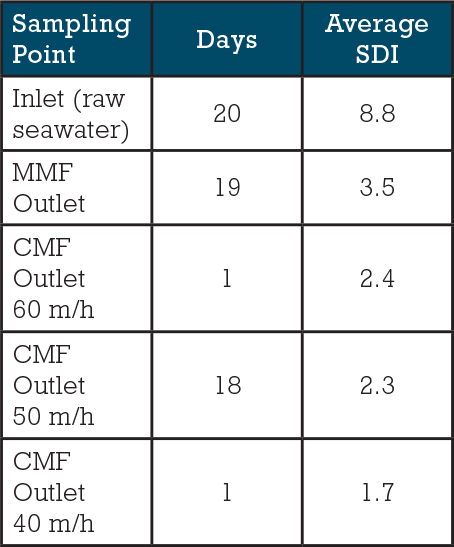
The first objective was measuring the field performance of CMF in comparison with existing MMF as pretreatment to a SWRO system. The following table represents all measurements of SDI performed for raw water as well as filtered water by MMF and CMF filtration systems.
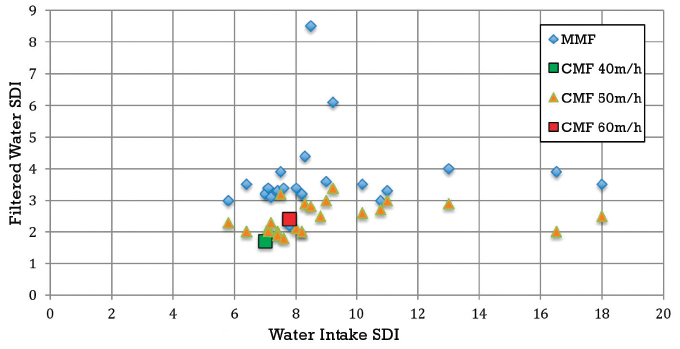
As for the preliminary tests conducted on the U.S. West Coast, the SDI based on fouling rate measurements was calculated for each sampling observation. Again, the average SDI calculated for CMF treated water indicates a significantly lower value than the average value calculated for MMF.
The CMF was also operated briefly at 40, 50, and 60 m3/m2/h to select the most appropriate flow rate for the long-term comparison with the combination CMF/MMF RO membrane. The SDI was the main factor used to differentiate the optimal operating rate. Graph 3 highlights the lower SDI values observed of the filtered water coming out of the CMF in comparison to MMF.
The detailed analysis of the SDI measurement coming out of CMF at 50 m/h indicates that 50 percent of the values are smaller than 2.4 and 33 percent of the values are equal to or smaller than 2.0. The only test performed at 40 m/h reached an SDI value of 1.7. Finally, the only test performed at 60 m/h reached an SDI value of 2.4.
It appears that a slower speed, such as 40 m/h, combined with CMF features could perform at SDI values smaller than 2.0. According to past experiences, a smaller SDI tends to improve the overall SWRO Plant operating costs. From this document’s published date, the study is planned to perform twenty more days to confirm 40 m/h as the optimal speed, and to compare both systems for a duration of 90 to 120 equivalent full days of operation.
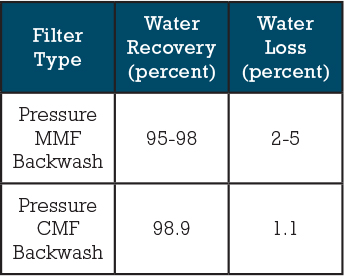
BACKWASH COMPARISON AND WATER RECOVERY
Granular media filters are typically backwashed using filtered seawater or concentrate from the SWRO membrane system. Filter cell backwash frequency is usually once every twenty-four to forty-eight hours and spent (waste) backwash volume is 2 percent to 5 percent of the intake seawater (i.e., recovery rate of 95 percent to 98 percent). The CMF backwash reached a high-end water recovery of 98.9 percent at 50 m/h.
Phase 2 started in September 2017 to observe and measure the impact of the two different pre-treated water qualities on the performance of the downstream SWRO process. Based on optimal operating conditions, each pretreatment is connected to its specific SWRO train. Cleaning frequency and water quality are the most important parameters in determining the best pretreatment filter.
Phase 3 will begin after optimal operating conditions are reached and will aim at evaluating and comparing the life-cycle costs of CMF versus MMF. More specifically, it is planned to compare specific costs related to filtration run time, water recovery, cleaning frequency, chemical consumption, power cost, feed pressure, and backwash volume.
CONCLUSION
The study demonstrated the superior efficiency of cross-flow microsand filtration at reducing suspended solids and silt density index (SDI) from seawater, when compared to conventional multi-media filters. With a filtration rate of 50 m/h the CMF filter produces 33 percent of the time, water with SDI equal to or smaller than 2.0. Filtration rates of 3 to 4 times those of MMF were achieved.
It appears that cross-flow microsand filtration is a better alternative to conventional filtration methods and has the potential to significantly reduce the life cycle costs of SWRO desalination projects. Further studies will confirm long term technical performance and related impact on SWRO Capital and Operating cost.
The authors wish to acknowledge the National Research Council of Canada for funding part of this project through the Industrial Research Assistance Program (IRAP). The authors want to give a special thanks to WATCO (Egypt) for the availability of the testing site.
FOR MORE INFORMATION
Siemens Digital Industries Software, a business unit of Siemens Digital Industries, is a leading global provider of software solutions to drive the digital transformation of industry, creating new opportunities for manufacturers to realize innovation. With headquarters in Plano, Texas, and over 140,000 customers worldwide, we work with companies of all sizes to transform the way ideas come to life, the way products are realized, and the way products and assets in operation are used and understood. For more information, visit www.sw.siemens.com.
Vortisand is a trademark of Evoqua, its subsidiaries and affiliates in some countries. All other trademarks are those of their respective owners. Evoqua Water Technologies delivers products, solutions, and services to ensure water quality and consistency for municipalities, industrial water users, and recreational facilities. With more than a 100-year heritage of industry-leading brands and products, technical expertise, and unmatched customer service, Evoqua is the partner of choice for millions of water users across the globe. For more information, visit www.evoqua.com.
MODERN PUMPING TODAY, June 2019
Did you enjoy this article?
Subscribe to the FREE Digital Edition of Modern Pumping Today Magazine!