If you have been involved in pumping, piping, and design, you already know that there are a number of formulas for calculating losses. The two most common are the Darcy or Darcy-Weisbach formulas and the Hazen-Williams equations. The first requires the designer to know something about the internal roughness of the pipe and that he or she needs to calculate the Reynolds Number (Re) to be able to determine the appropriate friction factor for computing losses. The Hazen-Williams formula by comparison, tends to simplify the computation by absorbing a lot of the computational work into a C factor used in the computations.

When the designer seeks to design a piping system, he or she is really interested in the head loss per length of pipe or the total head losses on the system. In order to get that using the Hazen-Williams formulation, the equation is manipulated into the following:

Where k=1.318 for US customary units, and k=0.849 for SI units. Where D is the diameter of the pipe in inches, Q is the flow rate in gallons per minute. S is the head loss in the pipe in terms of psi per foot of piping, and the equation below expresses the same result where S is feet of head loss per foot of pipe.

NOTE: The equation has been modified to express head losses in terms of feet of head per foot of pipe. In metric terms the conversion factor is 10.716.
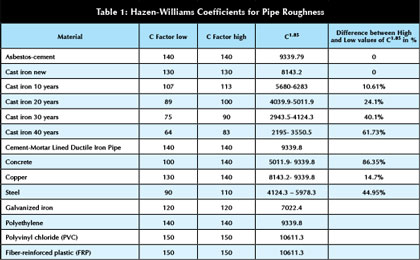
C is dependent upon materials properties as in Table 1.

The designer is free to use any value of C in calculating pipe friction losses by the Hazen-Williams formula. The selection of an appropriate factor in piping design can materially affect the calculated head loss and flow through the pipe. A number of designers routinely use a C=100 for all municipal installations, more or less regardless of the type of pipe and its age.
Given that value, the extreme variation can be up to almost 90 percent in velocity and flow.
For calculation of piping losses using the Darcy-Weisbach formula, the value of the friction factor is the all-important selection criteria because it directly determines the head losses in piping.
Where units are consistent in terms of feet and meters.

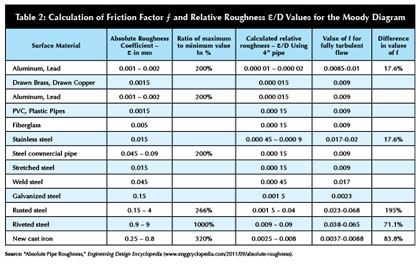
The friction factor f is determined from a Moody and the pipe internal diameter are in meters, for English units, the measurements are in feet. The Moody Chart uses ε/D, the internal pipe roughness over the diameter at various ranges of Re to compute the frictional losses in the pipes. This is known as relative roughness. The relative roughness in the diagram below, for fully turbulent flows (right hand values on chart) vary between 0.00001 and 0.07, or a factor of approximately 7000 while the friction factor varies over a range of 0.008 to 0.1, a factor of 12.5. Another way of looking at the data so that we are comparing similar values is to look at the range of relative roughness in various piping materials. The following table shows the absolute value in millimeters for various piping materials:

In order to get the following values for the influence of relative roughness on pipe friction in the above table, we made a couple of assumptions; 1) the flow was fully turbulent, 2) for sake of argument, we divided the relative roughness by a factor of 100 to simulate a 4-inch pipe (it’s actually 101millimeters) but the values and the extreme range to get the f values from the Moody Chart.
A note of caution needs to be injected here. Not all Moody Charts are the same! In preparing this article we first used different Moody diagrams, and found that some of them have f values which are different by 20 percent or more. There are many more consistent Moody Diagrams than irregular ones, so look over a few, and select carefully. (NOTE: Most Moody diagrams have the lower left hand value for f set at 0.008, and the upper left hand value for f at 0.1, but some cut the lower value off at 0.01.)
S. W. Churchill, developed an equation which models the Moody chart over its entire range.
The formula requires the calculation of the Reynolds Number (Re) which is
Where ρ is the density, μ is the dynamic viscosity (kg/(m-s)), and υ is the kinematic viscosity of the fluid (m2/s). This formula will model the Moody Diagram (NOTE: View the Excel® program on modernpumpingtoday.com for ease of calculation).

In conclusion, in the design of piping systems, frictional head loss can be a significant factor. The Moody diagram provides a more rational basis for design than the frequently used Hazen-Williams coefficients because it is dependent upon the pipe properties and internal roughness rather than upon the designer’s judgment. The Hazen-Williams formulations lead to understating piping losses when compared to the Darcy-Weisbach formula.

In the design of critical infrastructure systems the understated head losses can lead to under-sizing of the piping, higher losses, and lower flows that are desired at the delivery point. In some of these critical situations, such as fire flows, and municipal pipelines, the deliverable quantity of liquid could be significantly less than required, and sometimes that can be life-threatening.
In future articles we will look at the formulation of a spreadsheet for calculation of head losses and for minor losses.
ABOUT THE AUTHOR
David L. Russell, P.E., is a chemical and environmental engineer and the founder of Global Environmental Operations, Inc., a specialty environmental consulting firm serving clients all over the world. Mr. Russell is an in-demand consultant for projects ranging from environmental process designs and hazardous wastes to water systems and wastewater treatment. He can be reached at 770.923.4408 or by visiting www.globalenvironmental.biz.
MODERN PUMPING TODAY, July 2014
Did you enjoy this article?
Subscribe to the FREE Digital Edition of Modern Pumping Today Magazine!


