Proportional smart control valves play critical roles in process industries. Accurately assessing valve performance, however, can be a cumbersome routine that often involves substantial downtime as well as pulling the valves from the line.
Valves open and close proportionally and vary the degree of travel depending on a variable 4 to 20 mA signal applied to their input. Many valves have a feedback signal that shows the actual position as a percentage of open/close. This output can be a 4 to 20 mA signal or a digital HART variable that represents 0 to 100 percent of control valve operating span.
One other key indicator of a valve’s performance is the pressure needed by the valve to move it to the desired position. The valve is programmed to know that with 12 mA applied for example it is supposed to be 50 percent open. The smart electronics will control what is essentially a smart pressure regulator to increase or decrease the pressure as needed to move the control element to the desired position.
Applying a varying mA signal while also monitoring the output milliamp or percentage of travel signal tells you whether a control valve is operating correctly over its range. Monitoring and recording the pressure applied to the final control element while varying the input 4 to 20 mA signal to move the valve is a key test to identify if a valve is sticking. The pressure vs mA or position is normally linear if the valve is working correctly. If additional pressure is required due to sticking this will show if the measurements are logged and graphed. By recording those signals, the valve’s performance can be documented. This documented test and result is often called a valve’s “signature.” Valves typically include a simple manual indicator that gives you an approximation of the percent of travel for a setting when in operation. Yet that indicator does not show you how the valve will operate under dynamic and changing conditions, and its accuracy isn’t assured.
ON-VALVE INDICATORS A ROUGH MEASUREMENT
The indicator on the side of the valve might tell you it’s at 50 percent, but do you really know it’s not 51 percent or 49 percent? You can’t tell. And in many processes, that could make a difference. The most sophisticated valve performance tests require removing the valve and testing its performance on a “valve prover.” These are expensive sophisticated testing devices, which are out of range for many plants and shops. Other testing is possible with specialty HART test instruments but those can be difficult to set up and use.
Indeed, according to one process instrumentation instructor, a technician working with an assistant for a full day can accurately test about eight valves, or about one an hour. That includes having the assistant pull the valve, bringing the valve to the technician at a bench, then running the tests while the assistant is doing all the mechanical stuff. That’s roughly two man-hours to test one valve.

NEW CALIBRATOR AUTOMATES TEST
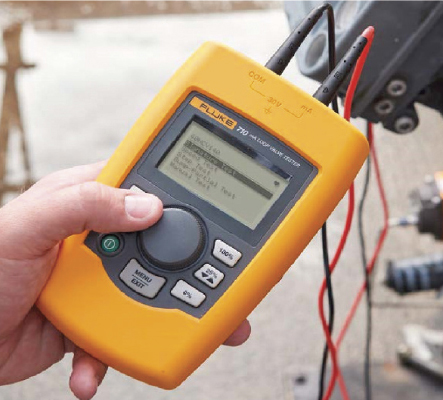
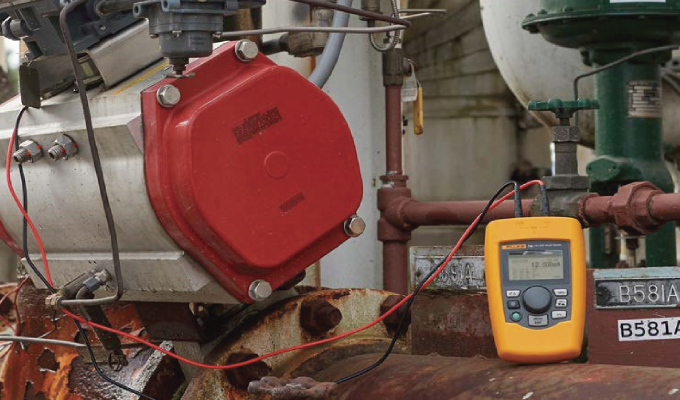
Fluke recently introduced a new loop calibration tool that quickly screens valves to determine if they are working properly. The tool saves time and helps prevent unneeded pulling of good control valves from their processes. The Fluke 710H Valve Tester is the latest in a generation of tools designed to make expert workflows more accessible to technicians of all skill levels while still offering the range of capabilities you expect from a process loop calibration tool.
The 710 includes several fully automated tests including the Signature test—which easily assesses the performance of a proportional smart valve. The test can often be accomplished in as little as five minutes. The Signature test provides you an easily understood status check on the valve—good, marginal, or bad.
You can send the lesser skilled instrumentation guy out to test the valves and determine whether a specialist needs to be called in. You’re not pulling the valve, which, like pulling a motor, is a lot of work. After removing control wires and connecting the 710 test leads, the Signature test automatically ramps the milliamp signal from 4 to 20 to 4 and records feedback from the valve to determine if the valve moves properly. It also records the pressure applied to the valve control element from 4 to 20 to 4 milliamps looking for smooth linear changes in pressure across the band—ascending and descending.
SCREEN WHETHER VALVE IS GOOD, MARGINAL, OR BAD
By profiling the pressure that’s being used to move the valve you can see physical spikes in the Fluke Corporation. A new control valve testing process amount of pressure required to move it through a point even though the position itself might be fairly close to where it’s supposed to be.
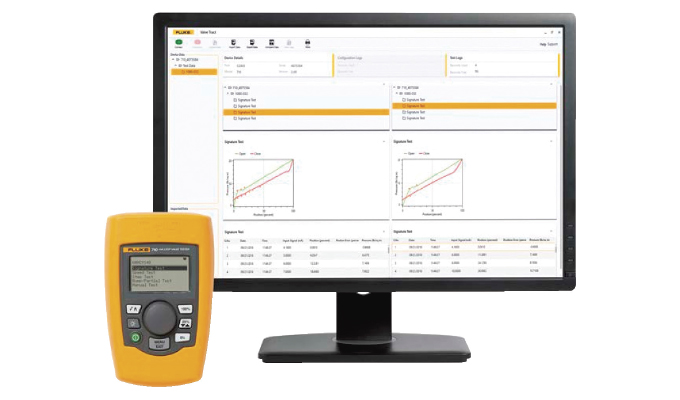
When the test is complete, you get an assessment of valve performance—bad, marginal, or good. The 710 will also record the data so you can upload it to application software where you can do further analysis.
Once the technician gets comfortable with the tool and can run the tests, they can determine whether to call a specialist.

BEST PRACTICE: BASELINE AND TREND
A best practice for keeping valves in great shape is to baseline valve performance measurements when in a known good state. Since most valves use a 4 to 20 mA input signal, a test tool with an mA output signal can provide the input mA signal to drive the control valve across its operating range. The 710 is ideal for this practice.
The documentation ideally takes place when a valve is commissioned or after an overhaul. The technician records the “signature” of the valve in the ideal state, plotting the output mA or percentage of span signal versus applied input signal. The information is stored along with the time, tag number of the valve, and the date the test was performed. Calibration management software can be used to manage this information.
Once the baseline performance signatures of the valves are recorded, a maintenance interval for testing the performance of the valves should be established. The interval depends on whether the application is rough service or light duty. Some devices installed in safety and shut-down systems, for example, should be checked every three months.
WHEN TO PULL A VALVE
If plotted data shows the valve has developed a nonlinear signature or has aberrations in the curves, the valve may be developing excessive stiction or hysteresis that may require it to be removed for service. An indication of “marginal” or “bad” on the 710 is also a signal to either perform the trim on the valve controller and/or bring in a specialist to determine if more extensive testing out of the process is required.
Here is a guide to the typical expected operation of a valve when a milliamp signal is applied:
- 3.8 mA – valve should be hard closed
- 4.0 mA – valve should remain closed
- 4.2 mA – valve should edge slightly off its seat
- 12 mA – valve should be at 50 percent
- 19.8 mA – valve should be near full open
- 20.0 mA – valve should be fully open
- 20.2 mA – valve should be at hard open (resting on stop)
ABOUT THE AUTHOR
Jim Shields is product manager for Fluke Process Tools. Fluke Calibration is a leader in precision calibration instruments, equipment, service, and software for electrical, RF, temperature, humidity, pressure, and flow measurements. For more information, visit www.fluke.com.
MODERN PUMPING TODAY, May 2019
Did you enjoy this article?
Subscribe to the FREE Digital Edition of Modern Pumping Today Magazine!


